Figure 5.

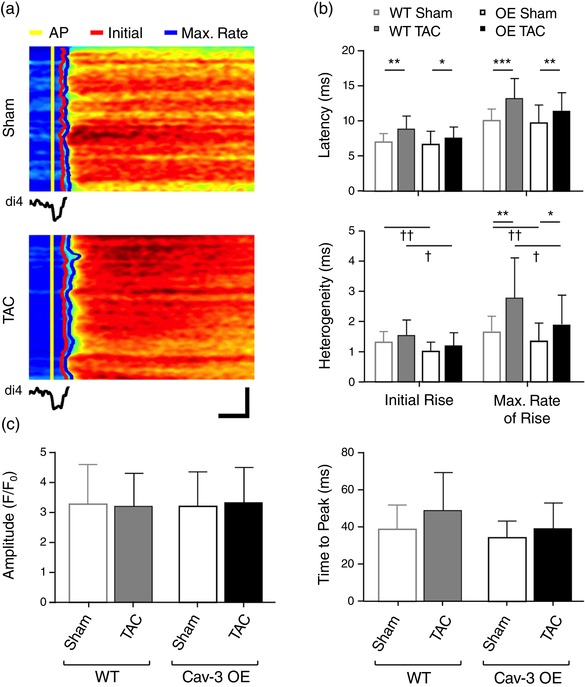
Local Ca2+ release and systolic Ca2+ transient. (a) Line‐scan images of the rising phase of the Ca2+ transient and (below) the associated average t‐tubular di‐4‐AN(F)EPPTEA signal in representative sham (top) and TAC (bottom) Cav‐3 OE myocytes. Horizontal scale bar: 10 ms; vertical scale bar: 5 μm. The time of the AP upstroke, initial rise of Ca2+ and maximum rate of rise of Ca2+ have been marked in yellow, red and blue, respectively. (b) Mean latency and heterogeneity of SR Ca2+ release in sham (n/N = 28/5) and TAC (n/N = 18/4) Cav‐3 OE myocytes compared with WT sham (n/N = 43/12) and TAC (n/N = 12/3) myocytes. (c) Whole cell Ca2+ transient amplitude (F/F 0) and time to peak (ms) measured from Ca2+ transients of sham (n/N = 25/5) and TAC (n/N = 22/4) Cav‐3 OE myocytes compared with WT sham (n/N = 53/13) and TAC (n/N = 14/3) myocytes. *P < 0.05, **P < 0.01, ***P < 0.001 between treatments for a given phenotype (WT or Cav‐3 OE); †P < 0.05, ††P < 0.01 between phenotypes for a given treatment (sham or TAC). The WT data have been published previously (Bryant et al., 2018a)
