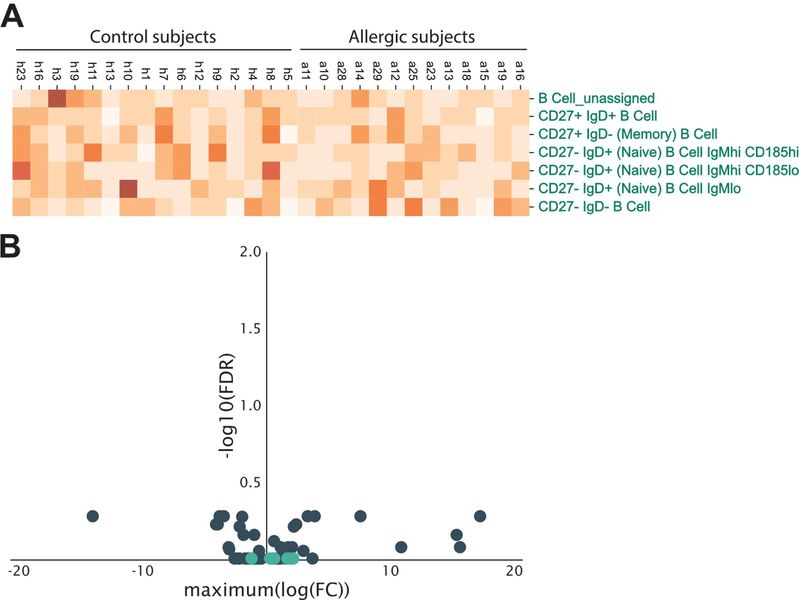
Figure 2. Comparable frequencies of curated B cell populations defined by automated gating in meat allergic and control subjects.
(A) Heatmap of the relative frequency of 7 different B cell populations in meat allergic (n = 19) and non-meat allergic control (n = 20) subjects. B cell populations were assigned by the Astrolabe Diagnostics analysis platform. (B) Differential abundance analysis of the frequencies of B cell populations (light blue dots) compared to non-B cell immune cell populations (dark blue dots) shows no difference between allergic and control subjects.

