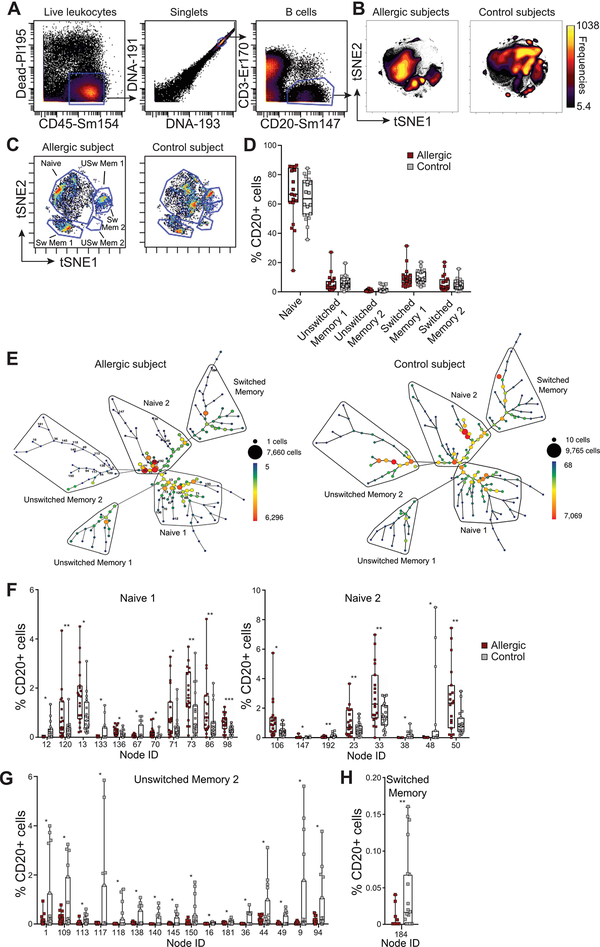
Figure 3. viSNE and SPADE analysis of CyTOF data shows phenotypic changes of B cells in meat allergic subjects.
(A) Gating strategy for viSNE analysis on CD20+ B cells. (B) viSNE plots of concatenated datasets from meat allergic (n = 19) and non-meat allergic (n = 20) control subjects. Plots are colored by cell frequency. (C) Data from 1 meat allergic and 1 control subject showing heterogeneous clusters of naïve B cells, unswitched memory B cells (USw Mem 1, USw Mem 2) and switched memory B cells (Sw Mem 1, Sw Mem 2) based on IgD and CD27 expression. (D) Frequencies of naïve, unswitched memory and switched memory B cells expressed as proportion of total CD20+ B cells of subjects were quantified by manual gating. (E) A SPADE tree derived from a meat allergic patient and a control subject annotated with naïve, unswitched memory and switched memory B cell types on the basis of IgD and CD27 expression. The size and color of each node denotes the number of cells. (F-H) Frequencies of B cells of each node statistically enriched in naïve, unswitched memory and switched memory branches expressed as the percentage of total CD20+ B cells. *P < 0.05, **P < 0.01, ***P < 0.001.

