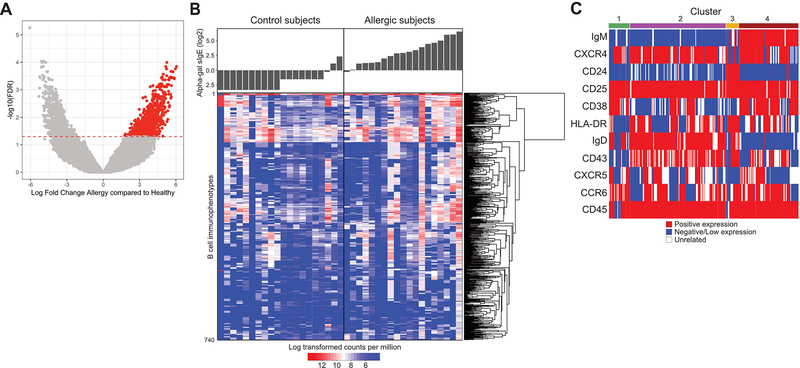
Figure 4. FlowType analysis identifies discrete B cell immunophenotypes that associate with alpha-gal sIgE in meat allergic subjects.
(A) Volcano plot of differentially abundant B cell immunophenotypes between meat allergic subjects and non-allergic controls, with negative log10-scaled FDR-corrected P-values on the Y-axis, and the log2 fold change on the X-axis. B cell immunophenotypes to the right and colored in red were comparatively found at higher frequencies in allergic patients, accounting for age and sIgE titers as covariates. The horizontal red line indicates a significance of 0.05 after adjustment of FDR using the Benjamini-Hochberg method. (B) Heat map resulting from flowType analysis of CyTOF datasets. Each row represents a distinct B cell immunophenotype based on marker expression levels, with its actual abundance in each subject expressed as log transformed counts per million indicated by the color scale. Corresponding serum alpha-gal sIgE for each subject is shown above the heat map. (C) Expression of 11 markers within the CyTOF panel needed to minimally define B cell immunophenotypes that were found significantly enriched in meat allergic subjects is represented graphically. Each row indicates the expression levels of an individual marker, with each column representing B cell immunophenotypes assigned to 4 main clusters based on the degree of shared marker expression.

