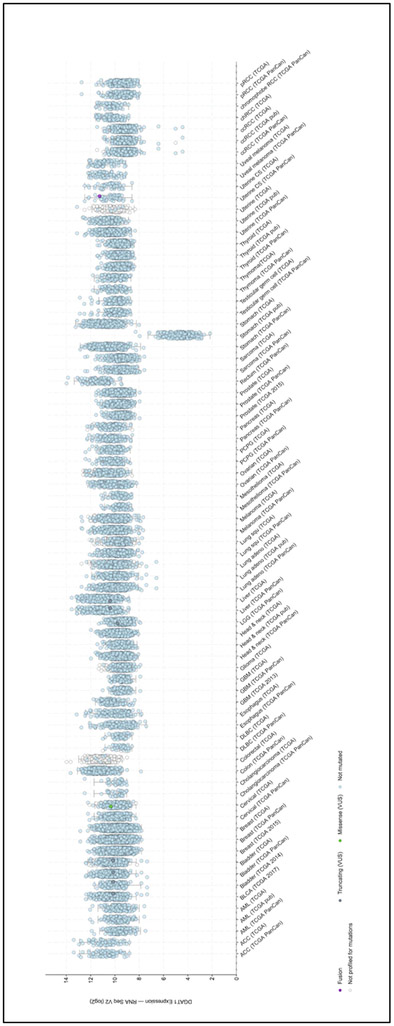
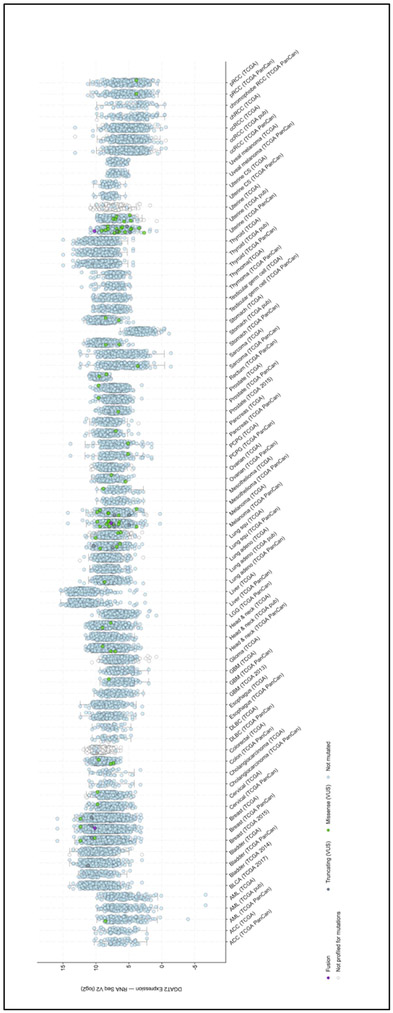
Figure 3. DGAT proteins are overexpressed in multiple cancers.
Analysis of the genetic alterations of DGAT1 (A) and DGAT2 (B) by cBioPortal (http://cbioportal.org). Every spot represents a single study. Purple spots represent fusion genes, grey sports represent truncating genes, green dot represent missense mutations, blue spots represent normal results of gene sequencing of DGAT1 or DGAT2 and white spots represent those analyzed without gene sequencing. Gene expression is represented as a logarithm in base 2.


