

Abstract
Mapping the structural and functional connectivity of the brain is a major focus of systems neuroscience research and will help identify causally important changes in neural circuitry responsible for behavioral dysfunction. Several methods for examining brain activity in humans have been extended to rodent and monkey models where molecular and genetic manipulations exist for linking to human disease. In this review paper, which is part of a special edition focused on bridging brain connectivity information across species and scale, we address mapping brain activity and neural connectivity in rodents using optogenetics in conjunction with either functional magnetic resonance imaging (Opto-fMRI) or optical intrinsic signal imaging (Opto-OISI). We chose to focus on these techniques because they are capable of reporting spontaneous or evoked hemodynamic activity most-closely linked to human neuroimaging studies. We discuss the capabilities and limitations of blood-based imaging methods, usage of optogenetic techniques to map neural systems in rodent models, and other powerful mapping techniques for examining neural connectivity over different spatial and temporal scales. We also discuss implementing strategies for mapping brain connectivity in humans with both basic and clinical applications, and conclude with how cross-species mapping studies can be utilized to influence preclinical imaging studies and clinical practices alike.
Keywords: Functional neuroimaging, Optogenetics, Transcranial magnetic stimulation, Functional connectivity, Effective connectivity, Structural connectivity
Introduction
Representation of function within the brain classically has been understood in terms of focality. For example, expressive language function has been attributed to the left inferior frontal cortex because focal damage to this part of the brain (Broca’s area) commonly results in expressive language deficits(1). However, it is increasingly recognized that performance deficits are best understood in terms of functional systems distributed over multiple parts of the brain(2). These functional systems are efficiently studied using “resting state” functional magnetic resonance imaging (fMRI), i.e., fMRI acquired without imposed tasks(3, 4). The topographies revealed by such analyses are equivalently known as either resting state networks (RSNs)(5), or intrinsic connectivity networks(6). The physiology underlying RSNs remains incompletely understood. While anatomical connectivity (white matter(7–15)) explains many features of functional connectivity(16), attempts to model whole-brain functional connectivity on the basis of connectional anatomy (all known white matter tracts) have been only partially successful(10, 17). Thus, anatomical and functional connectivity are related, but not in a simple one-to-one fashion. We shall shortly introduce a third type of connectivity, effective connectivity, which exhibits its own relations to the other connectivity measures. Studying these relations (brain connectomics) and dissecting the complex neural circuitry responsible for brain function (normal or abnormal) has emerged as a major focus of systems neuroscience research(18).
Classically, anatomic connectivity is studied by ex-vivo tracing of white matter tracts in brain slices(19). Today, structural connectivity can be non-invasively estimated in-vivo using diffusion tensor imaging(8) in combination with computational methods for reconstructing major fiber tracts(7). The basis of resting state functional connectivity (RS-FC) is that spontaneous fluctuations of blood oxygen level dependent (BOLD) signals, measured with either fMRI(20) or optical techniques(21), are temporally correlated within RSNs. RSNs commonly are mapped by extracting signals from regions-of-interest (see below) or computed using spatial independent component analysis(5). Both methods yield reliable and broadly similar results provided that the data are relatively uncorrupted by artifact and acquired over a sufficiently long time(22). The functional significance of RSNs derives from the observation that they topographically correspond to known sensory, motor, and “cognitive” functional systems (23, 24). Compared to task-based measures, RS-FC analyses have provided an efficient method for mapping the whole brain, and can be performed in patients incapable of performing tasks(25). Changes in RS-FC have been reported in a variety of neuro-psychiatric disorders(26) including Alzheimer’s disease(27), depression(28), schizophrenia(29), Parkinson’s disease(30) and stroke(31).
BOLD-fMRI is the dominant modality for measuring RS-FC in humans, and is becoming increasingly more adopted for examining the brain’s structure-function relationship in animals(9, 32, 33), including mice(10, 34). Importantly, whole-brain functional imaging in mice reveals large-scale functional network architecture corresponding to known murine structural connectivity patterns (34, 35). Moreover, basic functional connectional topology is conserved across mice, rats, primates, and humans(36, 37). Thus, bridge measurements can be made across animal models to enrich findings in human populations. Given the power of mice to aid in our understanding of human disease, longitudinal mapping techniques that probe brain circuitry more directly could profoundly illuminate pathology-related changes in brain organization.
Effective connectivity (EC) is distinct from, but related to, both anatomical and functional connectivity. EC measures the influence (direct or indirect) that one brain region exerts on another(38). The crucial distinction between RS-FC vs. EC is that RS-FC characterizes shared spontaneous (ongoing, intrinsic) signals. By definition, pairwise RS-FC is symmetric and uninformative regarding the directionality of propagated signals. Axonal propagation in living animals is physiologically uni-directional (from cell body to axon terminal). But, this directionality cannot be recovered either by histological tract tracing or DTI-based tractography(39). In contrast, EC reports how activity in an identified part of the brain affects other regions. Thus, measures of EC are not necessarily symmetric. In other words, (and neglecting ethical considerations), analyzing RS-FC is analogous to modeling social networks on Facebook by observation of friend relations; studying EC would be analogous to sending provocative material to known Facebook users and analyzing to whom the material spreads.
A frequently used non-invasive mode of studying EC in humans is measuring the influence of task-induced fMRI responses on the BOLD signal in other parts of the brain(40). Transcranial magnetic stimulation (TMS), the other major non-invasive technique for studying EC(41), is discussed at the end of this review. fMRI and TMS aside, the study of EC generally involves invasive techniques, e.g., direct cortical stimulation in patients undergoing surgical evaluation of intractable epilepsy (see(42, for recent reviews). The responses evoked by such stimuli (cortico-cortical evoked potentials; CCEPs) map out functionally connected regions on the surface of the brain. CCEP EC exhibits correspondence with anatomical connectivity as determined by DTI-based tractography(44). Recording electrophysiological responses to injected current has a long history in animal experimentation(11). More recently, the mode of stimulation and/or the means of recording the response have been replaced with more modern techniques such as calcium fluorescence imaging(12) and BOLD fMRI(45). As discussed below, combining optogenetic targeting with wide-field functional neuroimaging represents an even more powerful strategy for examining structure-function relationships in the mammalian brain.
In this review, we examine recently developed methods for EC mapping in animals in combination with optogenetics. We focus on techniques employing hemoglobin as the imaging contrast for linking with human fMRI findings. We use the general term “optogenetic effective connectivity (Opto-EC) mapping” to refer to these strategies for consistency with prior definitions in the literature(38, 46). We examine the spatiotemporal capabilities of hemodynamic mapping, as well as other mesoscopic mapping techniques that probe brain activity more directly. Finally, we discuss implementing strategies for mapping EC in the human brain using TMS for both basic and clinical applications, with attention to how cross-species mapping studies can be utilized to influence preclinical imaging studies and clinical practice.
Examining brain circuits with optogenetics
Optogenetic methods have revolutionized neuroscience by allowing researchers to control genetically-defined cell populations through optical stimulation of light-gated, opsin-expressing neurons(47). The most frequently used protein in optogenetics is channelrhodopsin-2 (ChR2), a non-selective cation channel that opens when illuminated with blue light(48) causing the targeted neuron to depolarize. Light-induced hyperpolarization is also possible though illumination of inhibitory opsins (e.g., archaerhodopsin or halorhodopsin) with yellow light(49). Opsin expression can be achieved through a variety of techniques including viral vector injection for retrograde or anterograde labeling(50), in utero electroporation(51), and transgenic approaches(52). The optogenetic toolbox is constantly evolving(26, 53). Red-shifted opsin variants(54) have been developed to allow for deeper tissue penetration or combinatorial excitation or depolarization of different populations of neurons(55). Other developments include the engineering of opsins that exhibit faster kinetics(56) to evoke ultra-fast firing frequencies in fast-spiking neurons(57), or “step function” opsins that cause long-term hyper- or hypo-excitability with a single light pulse but revert to prestimulus membrane potentials after a second pulse of light(58). Although the vast majority of optogenetic-based circuit mapping studies have been performed in the rodent, use of these techniques has been extended into non-human primates(59, 60).
Several optogenetic strategies have been implemented to examine neural connectivity over a range of temporal and spatial scales. At the micron scale, optogenetic stimulation in conjunction with multiple whole cell recording is able to map synaptic connections of individual cells. Functional connectivity within a microcircuit can be mapped using ChR2-assisted circuit mapping(51). For this method, a single neuron is used as a recording site while multiple regions are stimulated. This method can be used to map local circuitry within a cortical column, for example in somatosensory barrel cortex(61), or over longer distances spanning several millimeters(62). Maps of specific motor representations can be determined using ChR2-assisted, light-based motor mapping(63). Here, the site of photostimulation is controlled using mirrors, while motor outputs are recorded for quantifying limb(64–66) or whisker(67) movements. This technique can be applied longitudinally making it an attractive method for tracking cortical reorganization following injury(65). Systems-level connectivity (mm to cm) can be mapped using optogenetics in conjunction with wide-field mapping of brain activity. Voltage sensitive dye imaging(68, 69), calcium imaging(70, 71), and hemodynamic imaging(72–74) have all been successfully applied to measuring Opto-EC in the brain.
Chemogenetic technologies represent another powerful platform for probing genetically-targeted, neuro-anatomical circuits. The most widely used method, designer receptors exclusively activated by designer drugs (DREADDs), has been successful in mapping the influence of local circuit activity on global functional network organization across multiple species including mice(75), rats(33) and non-human primates(76). Due to space limitations, chemogenetics are not discussed in detail here. The interested reader is directed to(77) for review.
Hemodynamic mapping of brain circuitry
BOLD-fMRI and optical intrinsic signal imaging (OISI) have been used extensively to indirectly examine neural activity in the mammalian brain. Understanding how underlying electrophysiological activity, either in single or multiple cell populations, relates to the local hemodynamic response is essential for understanding the spatiotemporal capabilities of hemodynamic mapping. Please see Supplementary Material for an expanded discussion on using optogenetics to study neurovascular coupling and spatial resolution limits of hemodynamic mapping.
Activity-based mapping of brain circuitry requires examination of stimulus-evoked or spontaneous activity in the brain. We and others have developed methods for mapping local and distant EC using photostimulus-evoked activity with hemodynamic readout in rodents using either Opto-fMRI(73, 74, 78) or Opto-OISI(72, 79–82). For example, in transgenic Thy1-ChR2 mice, photostimulation of left motor cortex (Fig. 1A, blue ROI) results in local hemodynamic responses in oxygenated (HbO), deoxygenated (HbR), and total hemoglobin (HbT) at stimulated site measured with multispectral OISI (Fig. 1B). In the absence of an overt stimulus, intrinsic activity can also be measured (Fig. 1C). While each contrast can be used for mapping, HbO exhibits the largest signal changes, while HbT exhibits the highest contrast-to-noise(72), and is more closely linked to underlying neural activity(83). Single-wavelength OISI takes advantage of the differential absorption profiles of HbO and HbR to either collect measurements where HbO and HbR absorb light equally (so measurements are sensitive to changes in blood volume(13)) or at wavelengths where one contrast dominates (for collecting measurements sensitive to oxygenation(81, 84, 85)).
Figure 1. Hemodynamic mapping of brain activity.
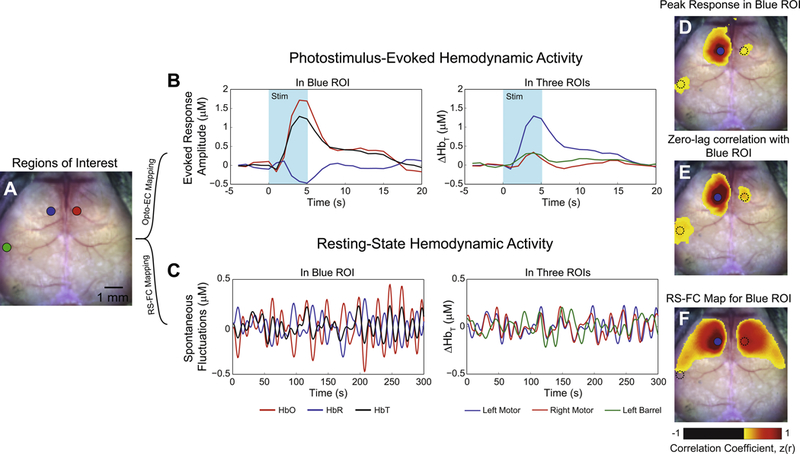
A) Dorsal view of the exposed, intact, mouse skull and regions of interest located in left motor (blue), left barrel (green), and right motor (red) cortex for demonstrating Opto-EC and RS-FC mapping strategies. B) Left plot: In transgenic Thy1-ChR2 mice, photostimulation of left motor cortex (473nm laser light, 0.5 mW, 5 ms pulses delivered at 10Hz for 5 seconds) results in local hemodynamic responses in oxygenated (HbO, red), deoxygenated (HbR, blue), and total hemoglobin (HbT, black). A single contrast is chosen for further examination of brain connectivity. In this example, we choose HbT as it is most closely related to underlying neural activity and exhibits the highest contrast to noise. Right plot: In left motor cortex, photostimulus evoked activity (blue trace) simultaneously evolves with distant hemodynamic activity in left barrel (green trace) and contralateral right motor cortex (red trace). C) Left plot: In the absence of any overt stimulus, spontaneous fluctuations of all 3 contrasts can also be measured in the same region. Right plot: Co-fluctuations in the same 3 regions are also observed under resting-state conditions. Notice, however, that spontaneous activity in left (blue) and right (red) motor cortex are approximately in phase while fluctuations in barrel cortex (green) are distinctly less coherent. D) Approximately 5 seconds after photostimulation, a map of peak HbT activity reveals wide spread activity in cortical regions surrounding the site of stimulation (blue dot). Additionally, activity in barrel cortex as well as evoked responses in the homotopic contralateral hemisphere suggests that these satellite regions are functionally-connected to the site interrogated. E) Zero-lag correlation between the region stimulated and all other brain regions produces an Opto-EC map (based on Thy1 excitatory stimulation) for left motor cortex. While topographically similar to the map of peak response in D, the connections with right motor and left barrel are more pronounced. The time courses in left/right motor and left barrel are all approximately in phase, but of different amplitudes; zero-lag correlation analysis is only sensitive to signal timing and immune to amplitude differences (within noise limits). F) Performing the same zero-lag correlation analysis with spontaneous HbT fluctuations in left motor cortex produces a resting state functional connectivity map for the blue region. Distinct topographical differences exist between the RS-FC map and the Opto-EC map. Unlike the Opto-EC map, the RS-FC map is symmetric about midline, and covers large portions of motor cortex and lateral somatosensory cortex. RS-FC between left motor and left barrel is notably absent. Maps in panels D, E, and F are thresholded at a Fisher z(r) value of 0.3. See reference (72) for more methodological details.
The most straightforward mapping method examines induced activity at a particular time after stimulation. Following photostimulation of left motor cortex, a map of peak activity (Fig. 1D) reveals a response surrounding the site of stimulation. Additionally, activity in left barrel and right motor cortices suggests that these regions are functionally-connected to the site interrogated. We can evaluate these connections using zero-lag correlation between activity in left motor and all other brain regions, to produce a left motor Opto-EC map (Fig. 1E). While similar topographically to the map of peak response, connections between left motor and left barrel are more pronounced. A different picture is observed when examining spontaneous fluctuations (Fig. 1C). Performing the same analysis of intrinsic activity shows a symmetric map covering large portions of motor cortex and lateral somatosensory cortex (Fig. 1F). Implementing these strategies for all sites interrogated yields a set of Opto-EC and RS-FC maps over the cortex (Fig. 2).
Figure 2: Cortical patterns of Opto-EC and RS-FC.
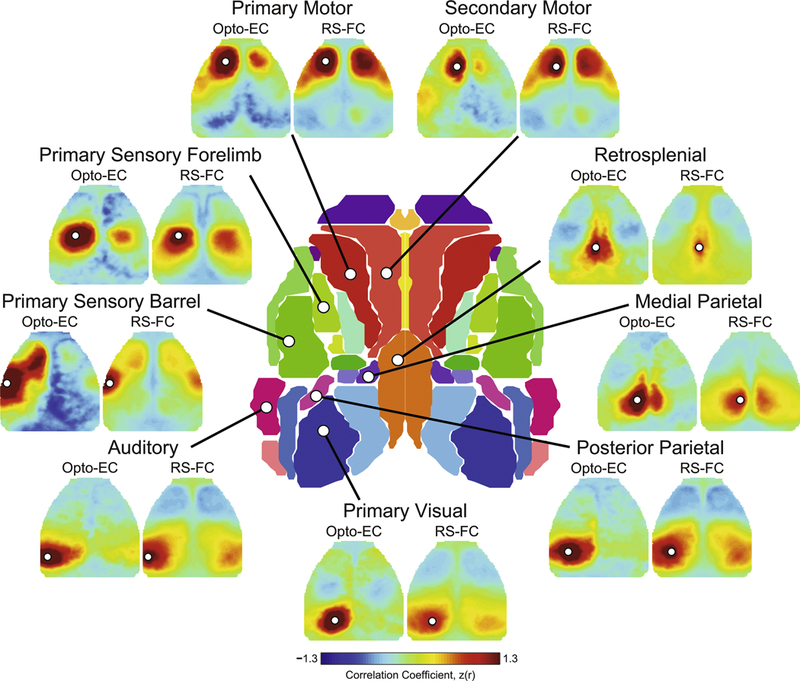
Opto-EC: Maps of Thy1-based, optogenetically defined effective connectivity in 5 mice calculated by zero-lag correlation of the evoked time course at the stimulated site and activity over the rest of the brain during over a 25 second epoch. RS-FC: Resting state functional connectivity maps in 8 mice calculated by zero-lag correlation of spontaneous time courses at the coordinates of stimulated sites and the rest of the brain (20–30 min/mouse) during a separate imaging session. All connectivity images were created using total hemoglobin as contrast. While both maps share common features, the RS-FC maps are both qualitatively and quantitatively different from their Opto-EC counterparts. For example, secondary motor cortex demonstrates ipsilateral EC with barrel cortex that is not present in the RS-FC map, and RS-FC maps are largely bilaterally symmetric. Further details can be found in (72). Data and figures modified from (72).
Patterns of Opto-EC are distinct from RS-FC maps
Several differences between RS-FC and Opto-EC maps are apparent. Stimulation of some regions, e.g., primary and secondary motor, and primary barrel cortex, generates distant responses that are not present in the corresponding RS-FC map (Fig. 2). Other major differences include the degree to which homotopic regions share coordinated activity. Bilaterally-symmetric RS-FC is very well documented in multiple species on the basis of fMRI and optical techniques(9, 13, 14, 20, 21, 86). A profound lack of homotopic EC is observed in barrel, visual, and posterior parietal regions (Fig. 2). These Opto-EC vs. RS-FC differences may provide insights into the nature of spontaneous activity. Synchronous activity in homotopic cortical regions, as reflected in RS-FC maps, may reflect monosynaptic, transcallosal connections or coordination by subcortical structures. RS-FC in the visual cortex of monkeys most likely involves polysynaptic pathways(9), and indirect cortico-cortical structural connectivity predicts interhemispheric RS-FC between human visual cortices(87). Additionally, the thalamus can regulate cortical excitability(88), and may do so selectively so that homotopic regions are excitable at the same time(15, 89, 90).
Opto-EC matches axonal projection connectivity more closely than RS-FC.
Given the differences between Opto-EC and RS-FC patterns, it is reasonable to hypothesize that one method reflects more directly underlying anatomical connectivity. We recently compared Opto-EC to patterns of axonal projection connectivity (APC)(72) collected from the Allen Mouse Brain Connectivity Atlas(91). For most sites evaluated, the similarities between the APC images and the Opto-EC maps were significantly higher compared to the RS-FC and APC maps (Fig. 3A). The highest overlap between Opto-EC and APC occurred in sensorimotor cortices (where the RS-FC patterns overlapped least). Interestingly, hemodynamic measures of Opto-EC within sensorimotor cortices appear to reflect the known input-output organization of these regions (Motor and Barrel regions in Figs. 2, 3A). In the rodent, whisker-based tactile sensation and sensorimotor integration are mediated by a connection loop between somatosensory barrel and motor cortices(92). We observe appreciable connection strength asymmetry between the primary motor cortex (M1) and the lateral barrel region of somatosensory cortex (S1BL) agreeing with previous studies reporting directionality within this system using invasive anatomical tracing(92) and other local(51, 93) and global(64, 69) in vivo ChR2-based methods measuring neural activity more directly. The similarity between Opto-EC and APC suggests that Opto-EC patterns tend to reflect pairwise connectivity between neurons, much like electrical stimulation of the cortex(94) while RS-FC appears to largely reflect polysynaptic pathways.
Figure 3: Global Opto-EC mapping to probe brain anatomy and function.
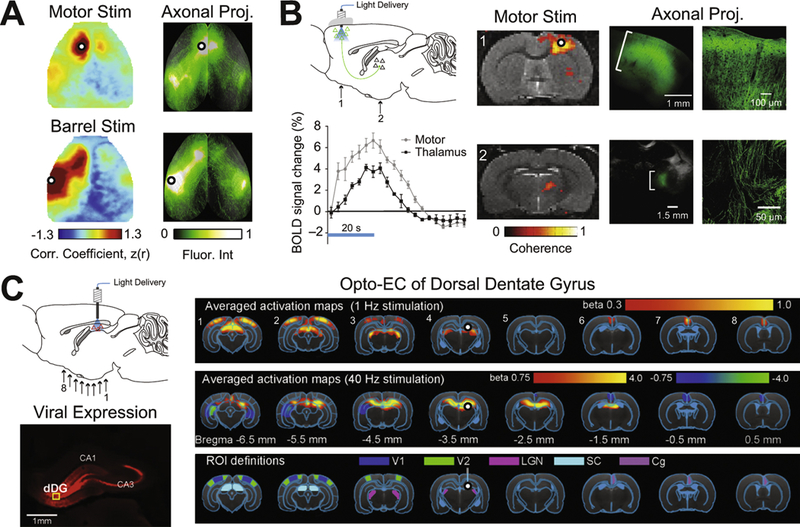
A) Maps of Thy1-based Opto-EC and RS-FC are compared to axonal projection connectivity (APC) images from the Allen Mouse Brian Connectivity Atlas. APC images were acquired using the source search feature within the Mouse Connectivity Data Portal and projected onto the cortical surface using the cortical map signal viewer, co-registered to OISI data and normalized by maximum fluorescence intensity. Generally, Thy1-based, Opto-EC maps report monosynaptic cortical connectivity structure, but can be collected in awake, behaving animals. See reference (72) for more details. B) Nonlocal mapping of cells defined by location and genetic identity. Top left: Viral injection (AAV5-CaMKIIα::ChR2-EYFP) and optical stimulation in primary motor cortex results in local (Motor, image 1) and distant (thalamus, image 2) BOLD responses. Fluorescence/bright-field images show ChR2–EYFP expression in motor and thalamic regions while confocal images show that expression is limited to axons. Figures modified from (74). C) Hippocampal–cortical pathways contribute to global RS-FC in the rodent. Viral injection of ChR2::CaMKIIα in dorsal dentate gyrus (dDG) excitatory neurons. Arrows below brain image indicate approximate locations of Opto-EC activation maps numbered 1 (posterior) through 8 (anterior). Histology image shows mCherry fluorescence from viral expression in dorsal hippocampus. Brain-wide activation maps of visually-related regions during low-frequency optogenetic stimulation of dDG excitatory neurons. Top row: Averaged activation maps from 1Hz photostimuli delivered to dDG show robust positive BOLD responses detected in bilateral V1, V2, LGN, and SC, as well as Cg. Middle row: High-frequency optogenetic stimulation (40Hz) of dDG excitatory neurons in dorsal hippocampus does not evoke brain-wide cortical and subcortical activation in V1, V2, LGN, and SC. Bottom row: Regions of interest (ROIs): Cg, cingulate cortex; LGN, lateral geniculate nucleus; SC, superior colliculus; V1, primary visual cortex; V2, secondary visual cortex. Figures modified from (90). In all images, white dot with black outline indicates stimulation site.
Global Opto-EC mapping to probe brain anatomy and function
The recent integration of optogenetics with fMRI and OISI has allowed for examining the effects of precise optogenetic manipulations on global brain activity. The first Opto-fMRI study delivered light to motor cortex as well thalamic targets to reveal BOLD responses resulting from local excitatory neural activity(74)(Fig. 3B). Reciprocal stimulation of the anterior thalamic nucleus resulted in bilateral motor responses while stimulation of the posterior thalamic nucleus resulted in ipsilateral somatosensory responses. These findings demonstrate different cortical projections of thalamic nuclei, in line with neural tracing studies, but also a thalamic role in shaping coherent spontaneous activity across hemispheres(15).
Changes in infraslow (<0.1Hz) spontaneous activity (e.g., as reflected in patterns of RS-FC) facilitate and modulate a diverse set of motor, sensory, and cognitive processes. However, the neural basis of RS-FC remains unknown. Most studies have only correlated measures of neural activity with hemodynamics instead of directly probing the effects of modulated, region-specific electrical activity on global RS-FC. With its dense reciprocal APC to and from the cortex, the hippocampus is believed to mediate numerous cognitive functions and sensory processing(95). Further, cortical slow oscillations(1Hz), which are phase-locked with cellular activity in the dentate gyrus(96), resemble the spatiotemporal characteristics of infraslow activity in RSNs. Thus, low-frequency activity in hippocampal–cortical pathways could contribute to global RS-FC to integrate sensory information. Chan and colleagues examined large-scale effects of spatiotemporal-specific propagation of downstream hippocampal activity on global RS-FC(90). In that study, stimulation of excitatory neurons in the dorsal dentate gyrus at low frequency(1Hz), but not high frequency(40Hz), evoked robust cortical and subcortical brain-wide responses (Fig. 3C). Low-frequency stimulation enhanced interhemispheric hippocampal and cortical RS-FC. LFP recordings revealed an increase in slow oscillations in the hippocampus and visual cortex, interhemispheric visual RS-FC, and hippocampal– cortical RS-FC. Together, these results highlight the role of low-frequency activity propagating along the hippocampal–cortical pathway, and its contribution to interhemispheric cortical RS-FC.
Opto-EC mapping can also identify large-scale brain networks corresponding to specific behavioral and electrophysiological markers. For example, the thalamus plays a crucial role in coordinating brain signaling responsible for cognition and normal waking behavior(97). The central thalamus and intralaminar nuclei are postulated to regulate arousal, attention, and goal-oriented behavior(98). Using Opto-fMRI in conjunction with electrophysiology, Liu et al., examined the thalamic-driven global brain networks responsible for switching across brain states(99) with activity corresponding to electrophysiological metrics of arousal (e.g., spindle-like oscillations). In a separate study, stimulation of excitatory cells in intermediate hippocampus caused widespread BOLD signaling at high frequencies and predicted seizure-like after-discharges in EEG recordings and behavioral output(100).
EC Mapping in humans
Non-invasive strategies for mapping brain connectivity in the human brain have primarily employed TMS, which offers a less painful alternative to current injection through the scalp(101). The basic principle underlying TMS is that rapidly switched current though a coil placed over the scalp induces an electric potential around the coil which stimulates the brain. Repetitive TMS (rTMS) refers to pulse train stimulation at frequencies in the range of 1–50Hz. Pulse trains of duration on the order of few seconds often are delivered over minutes with the objective of inducting temporary changes in cortical excitability. Whether rTMS is inhibitory or excitatory has been thought to depend on pulse frequency (<1Hz: inhibitory; >5Hz: excitatory)(102). However the sign of observed effects does not always follow this rule(41, 103). Theta-burst TMS (brief pulse trains [3 pulses at 50Hz], rhythmically delivered at theta frequencies [5Hz]) over tens of minutes, is frequently used to induce plasticity(104).
Basic physiological investigations in animals have established that several seconds of rTMS initially increases cerebral blood flow (CBF) immediately under the coil; the initial response lasts on the order of a minute after which blood flow becomes depressed(105). Similar physiologic “activation” responses have been observed with [14C]-deoxyglucose autoradiography(106) and measurement of regional CBF using [15O]H2O positron emission tomography (PET)(107). In humans, increases in CBF have been observed using arterial spin labeling MRI(108) and near infrared spectroscopy (NIRS)(109). Importantly, these physiological responses do not reflect enhanced neural function. Single-unit discharge under the coil might variably increase or decrease following rTMS(110) while neural responses to natural stimuli generally are disrupted(105). This effect commonly is referred to as a “virtual lesion”(111). For example, occipital rTMS disrupts RS-FC within the visual system and degrades performance on a visual discrimination task(112). A particularly informative example of the virtual lesion effect was observed in an experiment in which 10Hz occipital rTMS impaired Braille reading in lifelong blind individuals, thereby demonstrating that a part of the brain normally used for vision had been reconfigured to analyze haptic (tactile) information(113). A recent meta-analysis of 29 studies confirmed that continuous theta-burst rTMS reliably impairs executive function(114). However, exceptions to this general rule exist. In normal volunteers, 20Hz parietal rTMS (daily 2s bursts every 30s × 20min × 5days) increased FC within the hippocampal-parietal memory system and significantly improved associative memory performance(115).
To study EC, TMS is combined with additional techniques including EEG(116), magnetoencephalography(117), PET(118), NIRS(119), or fMRI(120). The variety of such “multimodal” TMS experiments is thoroughly covered in recent reviews(41, 121). Combining TMS with EEG arguably is methodologically most similar to the above-reviewed Opto-EC studies in rodents. Thus, single-pulse TMS delivered to left motor cortex reliably evokes electrophysiological responses that evolve over ~400ms to involve functionally-related parts of the brain(122). Most experiments combining fMRI with TMS stimulate with pulse trains (i.e., rTMS) and measure BOLD responses both under the coil as well as in functionally-related parts of the brain remote from the stimulated site(123, 124). The response may depend on whether the remote region is engaged by a concurrently administered behavioral task. For example, 10Hz right parietal rTMS (delivered alone) depresses CBF in left primary sensory cortex; however, in the presence of right median nerve shocks, CBF in left S1 is enhanced. Moreover, 10Hz right parietal rTMS enhances detection of near-threshold right median nerve stimuli(125). Similar “state-dependent” modulations of EC between dorsal premotor cortex and motor cortex have been demonstrated with motor tasks(126).
A wide variety of neurologic and psychiatric disorders have implemented TMS therapy(127). The rational basis for the therapeutic effect is specific to condition. Unilateral stroke might destroy the part of the brain controlling motor function on the opposite side of the body. It follows that weakness contralateral to the stroke is attributable to loss of function. However, interference from the intact hemisphere, which often is over-active, also is a factor. Thus, inhibitory(1Hz) TMS over the intact hemisphere as well as excitatory(10Hz) stimulation over the lesioned hemisphere both may improve motor function of the paretic hand(128). In Parkinson disease, the physiological abnormality responsible for rigidity and bradykinesia (inability to initiate action) is persistent, abnormally hypersynchronous beta(15–30Hz) activity throughout the motor system (cortex, basal ganglia, thalamus). High frequency stimulation of the subthalamic nucleus via implanted electrodes often restores mobility by disrupting the pathological hypersynchrony(129). High frequency rTMS of motor cortex offers a non-invasive (but less permanent) alternative that could work via the same mechanism(130).
From Man to Mouse to Man: Iterating between preclinical and clinical findings
Depression is the condition most often treated by rTMS. Converging neuroanatomical and post-mortem histological evidence points to VMPFC as a specific locus of dysfunction in depression(131). rTMS offers a non-invasive alternative to DBS, but the challenge is that VMPFC is a deep structure not directly accessible to TMS. However, experimental evidence indicates that rTMS can be optimized by targeting a specific region in dorsolateral prefrontal cortex (DLPFC) known to be maximally anticorrelated with VMPFC in normal individuals(132). This result represents a case in which RS-FC mapping in normal subjects has informed the clinical therapy of depression. Clinical efficacy may be further improved by targeting the specific DLPFC region maximally anticorrelated with VMPFC individually identified in each patient using information gleaned from RS-FC mapping(133).
Further dissection of PFC circuitry via EC mapping in animal models could also help improve the specificity of targeted therapy. Depression is linked to several neural pathways, and distinct neuromodulatory systems and receptors(53). In animal models of depression, the medial prefrontal cortex (mPFC) is the most typically examined, and has been dissected anatomically and functionally using optogenetics. For example, selective activation or suppression of VMPFC circuits in rodents has established the causal relationship between mPFC connectivity and depression-like behaviors(134, 135). Mesolimbic dopamine circuitry is also widely studied in models of depression(136). A key component of this circuitry are dopamine neurons in the ventral tegmental area (VTA) that project to the limbic regions, such as the nucleus accumbens, amygdala and the PFC(137). This mesolimbic system is thought to be functionally-distinct from dopamine-innervated basal ganglia regions. However, Lohani and colleagues(138) demonstrate that phasic stimulation of VTA dopamine neurons increased BOLD signaling in known VTA-innervated regions, but also in regions that receive little or no VTA dopaminergic input (thalamus, hippocampus and dorsal striatum)(138). Thus, Opto-EC mapping is capable of identifying novel circuits within RSNs for probing questions about causal changes in circuit communication responsible for behavioral dysfunction. Compared to other diseases the myriad symptoms that define clinical depression cannot all be accurately modeled in animals. One strategy for linking clinical findings in patients with experimental work (and vice versa) would be to focus on human behavioral symptoms having measurable correlates in animal models.
Summary and Conclusion
We have reviewed several related but distinct forms of mapping brain connectivity: anatomical connectivity (white matter tracts), effective connectivity (how activity in one part of brain affects function elsewhere) and “functional” connectivity (correlated infraslow spontaneous activity) (Figure 4). Owing to space limitations, we have omitted discussion of many important topics, for example, that infraslow spontaneous activity, as imaged with hemoglobin-dependent signals, propagates over centimeter-scale distances at velocities far slower than axonal propagation of action potentials(139). The physiology underlying this phenomenon currently is not understood.
Figure 4:
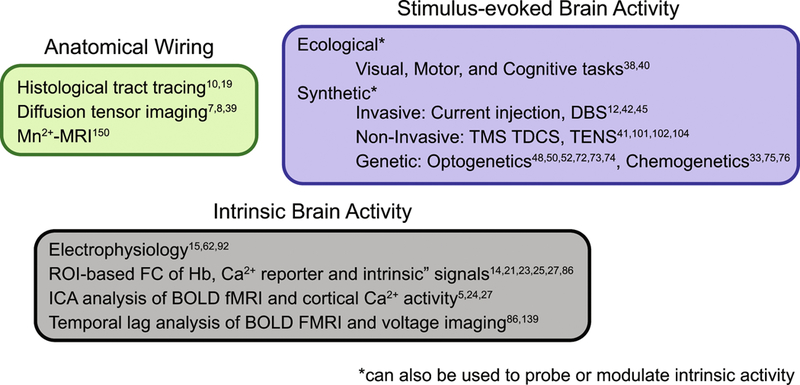
Tools for mapping brain connectomics. Mapping anatomical, or white matter, connections of the brain can be performed with ex vivo histological tract tracing(10, 19), or in vivo using diffusion tensor imaging (7, 8, 39) or manganese-enhanced MRI(150). Mapping the functional organization of the brain can be performed in vivo by invoking ecological (physiologically normal) stimuli as functional localizers (38, 40), or via synthetic (non-physiological) stimuli via invasive (12, 42, 45), non-invasive(41, 101, 102, 104), or genetics-based (33, 48, 50, 52, 72–76) strategies. In the absence of any overt task, ongoing spontaneous or intrinsic brain activity can be evaluated through electrophysiology(15, 62, 92), ROI-based (14, 21, 23, 25, 27, 86) or ICA-based(5, 24, 27) analyses, as well as through evaluating the relative timing differences in regional activity propagation (temporal lag analysis) (86, 139). Abbreviations: Mn2+-MRI: manganese enhanced magnetic resonance imaging; DBS: deep brain stimulation; TMS: transcranial magnetic stimulation; TDCS: transcranial direct current stimulation; TENS: transcutaneous electrical nerve stimulation; ROI: region of interest; Ca2+: Calcium; ICA independent component analysis; BOLD: Blood oxygen level dependent; FMRI: Functional magnetic resonance imaging.
Much of the presently-reviewed findings were obtained in the mouse but very likely apply to humans as basic principles of brain connectomics are conserved across a wide range of species(37). We have focused on recently-developed methods capable of specifically stimulating excitatory(69, 72, 73, or inhibitory(74, 79) neurons. New technologies for examining responses include calcium signaling within neurons(139–142), or astrocytes(143). Advances in genetically-encoded, fluorescent protein voltage indicators continues to progress(144, 145); this technology may eliminate some of the problems associated with voltage-sensitive dye signaling (indiscriminant labeling, cytotoxicity) and could allow for wide-field, systems-level all-optical electrophysiology(146, 147). These methods, perhaps in combination with red-shifted opsins, will undoubtedly reveal temporal processes and other aspects of neural interactions important for sustaining normal brain function.
We concluded this review with brief overview of human rTMS with an emphasis on treatment of depression. As discussed above, multiple lines of evidence derived from animal experimentation support rTMS as a treatment for depression. However, notwithstanding its widespread use, the efficacy of rTMS as a treatment for depression has not been established(148). A recent meta-analysis of 61 published studies suggests that a significant fraction of positive clinical responses is attributable the placebo effect(149). Thus, there remains a gap between the rich body of accumulated connectomics knowledge and practical clinical application. This is not cause for discouragement as basic science eventually leads to practical benefits.
Supplementary Material
Acknowledgements
This work was supported in part by National Institutes of Health grants R01NS102870 (AQB), K25NS083754 (AQB), P01NS080675 (AZS) and P30NS098577 (AZS)
Footnotes
Publisher's Disclaimer: This is a PDF file of an unedited manuscript that has been accepted for publication. As a service to our customers we are providing this early version of the manuscript. The manuscript will undergo copyediting, typesetting, and review of the resulting proof before it is published in its final citable form. Please note that during the production process errors may be discovered which could affect the content, and all legal disclaimers that apply to the journal pertain.
Disclosures
The authors report no biomedical financial interests or potential conflicts of interest.
References
- 1.Mohr JP, Pessin MS, Finkelstein S, Funkenstein HH, Duncan GW, Davis KR (1978): Broca aphasia: pathologic and clinical. Neurology 28:311–324. [DOI] [PubMed] [Google Scholar]
- 2.Siegel JS, Ramsey LE, Snyder AZ, Metcalf NV, Chacko RV, Weinberger K, et al. (2016): Disruptions of network connectivity predict impairment in multiple behavioral domains after stroke. Proc Natl Acad Sci U S A 113:E4367–4376. [DOI] [PMC free article] [PubMed] [Google Scholar]
- 3.Biswal B, Yetkin FZ, Haughton VM, Hyde JS (1995): Functional connectivity in the motor cortex of resting human brain using echo-planar MRI. Magnetic resonance in medicine 34:537–541. [DOI] [PubMed] [Google Scholar]
- 4.Raichle ME (2015): The restless brain: how intrinsic activity organizes brain function. Philos Trans R Soc Lond B Biol Sci 370:20140172. [DOI] [PMC free article] [PubMed] [Google Scholar]
- 5.Beckmann CF, DeLuca M, Devlin JT, Smith SM (2005): Investigations into resting-state connectivity using independent component analysis. Philos Trans R Soc Lond B Biol Sci 360:1001–1013. [DOI] [PMC free article] [PubMed] [Google Scholar]
- 6.Seeley WW, Menon V, Schatzberg AF, Keller J, Glover GH, Kenna H, et al. (2007): Dissociable intrinsic connectivity networks for salience processing and executive control. J Neurosci 27:2349–2356. [DOI] [PMC free article] [PubMed] [Google Scholar]
- 7.Behrens TEJ, Berg HJ, Jbabdi S, Rushworth MFS, Woolrich MW (2007): Probabilistic diffusion tractography with multiple fibre orientations: What can we gain? NeuroImage 34:144–155. [DOI] [PMC free article] [PubMed] [Google Scholar]
- 8.Le Bihan D (2003): Looking into the functional architecture of the brain with diffusion MRI. Nature Reviews Neuroscience 4:469. [DOI] [PubMed] [Google Scholar]
- 9.Vincent JL, Patel GH, Fox MD, Snyder AZ, Baker JT, Van Essen DC, et al. (2007): Intrinsic functional architecture in the anaesthetized monkey brain. Nature 447:83–86. [DOI] [PubMed] [Google Scholar]
- 10.Grandjean J, Zerbi V, Balsters JH, Wenderoth N, Rudin M (2017): Structural Basis of Large-Scale Functional Connectivity in the Mouse. J Neurosci 37:8092–8101. [DOI] [PMC free article] [PubMed] [Google Scholar]
- 11.Asanuma H, Stoney SD Jr., Abzug C (1968): Relationship between afferent input and motor outflow in cat motorsensory cortex. J Neurophysiol 31:670–681. [DOI] [PubMed] [Google Scholar]
- 12.Histed MH, Bonin V, Reid RC (2009): Direct activation of sparse, distributed populations of cortical neurons by electrical microstimulation. Neuron 63:508–522. [DOI] [PMC free article] [PubMed] [Google Scholar]
- 13.Kura S, Xie H, Fu B, Ayata C, Boas DA, Sakadzic S (2018): Intrinsic optical signal imaging of the blood volume changes is sufficient for mapping the resting state functional connectivity in the rodent cortex. Journal of neural engineering 15:035003. [DOI] [PMC free article] [PubMed] [Google Scholar]
- 14.White BR, Bauer AQ, Snyder AZ, Schlaggar BL, Lee JM, Culver JP (2011): Imaging of functional connectivity in the mouse brain. PloS one 6:e16322. [DOI] [PMC free article] [PubMed] [Google Scholar]
- 15.Xiao D, Vanni MP, Mitelut CC, Chan AW, LeDue JM, Xie Y, et al. (2017): Mapping cortical mesoscopic networks of single spiking cortical or sub-cortical neurons. eLife 6:e19976. [DOI] [PMC free article] [PubMed] [Google Scholar]
- 16.Behrens TE, Sporns O (2012): Human connectomics. Curr Opin Neurobiol 22:144–153. [DOI] [PMC free article] [PubMed] [Google Scholar]
- 17.Honey CJ, Thivierge JP, Sporns O (2010): Can structure predict function in the human brain? NeuroImage 52:766–776. [DOI] [PubMed] [Google Scholar]
- 18.Fornito A, Zalesky A, Breakspear M (2015): The connectomics of brain disorders. Nature Reviews Neuroscience 16:159–172. [DOI] [PubMed] [Google Scholar]
- 19.Jones EG (1999): Making brain connections: Neuroanatomy and the work of TPS Powell, 1923–1996. Annu Rev Neurosci 22:49–103. [DOI] [PubMed] [Google Scholar]
- 20.Shehzad Z, Kelly AM, Reiss PT, Gee DG, Gotimer K, Uddin LQ, et al. (2009): The resting brain: unconstrained yet reliable. Cereb Cortex 19:2209–2229. [DOI] [PMC free article] [PubMed] [Google Scholar]
- 21.Eggebrecht AT, Ferradal SL, Robichaux-Viehoever A, Hassanpour MS, Dehghani H, Snyder AZ, et al. (2014): Mapping distributed brain function and networks with diffuse optical tomography. Nature photonics 8:448–454. [DOI] [PMC free article] [PubMed] [Google Scholar]
- 22.Laumann TO, Gordon EM, Adeyemo B, Snyder AZ, Joo SJ, Chen MY, et al. (2015): Functional System and Areal Organization of a Highly Sampled Individual Human Brain. Neuron 87:657–670. [DOI] [PMC free article] [PubMed] [Google Scholar]
- 23.Power JD, Cohen AL, Nelson SM, Wig GS, Barnes KA, Church JA, et al. (2011): Functional network organization of the human brain. Neuron 72:665–678. [DOI] [PMC free article] [PubMed] [Google Scholar]
- 24.Smith SM, Fox PT, Miller KL, Glahn DC, Fox PM, Mackay CE, et al. (2009): Correspondence of the brain’s functional architecture during activation and rest. Proceedings of the National Academy of Sciences 106:13040–13045. [DOI] [PMC free article] [PubMed] [Google Scholar]
- 25.Hacker CD, Laumann TO, Szrama NP, Baldassarre A, Snyder AZ, Leuthardt EC, et al. (2013): Resting state network estimation in individual subjects. Neuroimage 82:616–633. [DOI] [PMC free article] [PubMed] [Google Scholar]
- 26.Gradinaru V, Zhang F, Ramakrishnan C, Mattis J, Prakash R, Diester I, et al. (2010): Molecular and Cellular Approaches for Diversifying and Extending Optogenetics. Cell 141:154–165. [DOI] [PMC free article] [PubMed] [Google Scholar]
- 27.Buckner RL, Sepulcre J, Talukdar T, Krienen FM, Liu H, Hedden T, et al. (2009): Cortical Hubs Revealed by Intrinsic Functional Connectivity: Mapping, Assessment of Stability, and Relation to Alzheimer's Disease. The Journal of Neuroscience 29:1860. [DOI] [PMC free article] [PubMed] [Google Scholar]
- 28.Alexopoulos GS, Hoptman MJ, Kanellopoulos D, Murphy CF, Lim KO, Gunning FM (2012): Functional connectivity in the cognitive control network and the default mode network in late-life depression. Journal of affective disorders 139:56–65. [DOI] [PMC free article] [PubMed] [Google Scholar]
- 29.Fox MD, Snyder AZ, McAvoy MP, Barch DM, Raichle ME (2005): The BOLD onset transient: identification of novel functional differences in schizophrenia. Neuroimage 25:771–782. [DOI] [PubMed] [Google Scholar]
- 30.Gratton C, Koller JM, Shannon W, Greene DJ, Snyder AZ, Petersen SE, et al. (2018): Emergent Functional Network Effects in Parkinson Disease. Cereb Cortex [DOI] [PMC free article] [PubMed]
- 31.Carter AR, Patel KR, Astafiev SV, Snyder AZ, Rengachary J, Strube MJ, et al. (2012): Upstream dysfunction of somatomotor functional connectivity after corticospinal damage in stroke. Neurorehabilitation and neural repair 26:7–19. [DOI] [PMC free article] [PubMed] [Google Scholar]
- 32.Otte WM, van der Marel K, van Meer MP, van Rijen PC, Gosselaar PH, Braun KP, et al. (2015): Altered contralateral sensorimotor system organization after experimental hemispherectomy: a structural and functional connectivity study. Journal of cerebral blood flow and metabolism : official journal of the International Society of Cerebral Blood Flow and Metabolism 35:1358–1367. [DOI] [PMC free article] [PubMed] [Google Scholar]
- 33.Roelofs TJM, Verharen JPH, van Tilborg GAF, Boekhoudt L, van der Toorn A, de Jong JW, et al. (2017): A novel approach to map induced activation of neuronal networks using chemogenetics and functional neuroimaging in rats: A proof-of-concept study on the mesocorticolimbic system. Neuroimage 156:109–118. [DOI] [PubMed] [Google Scholar]
- 34.Stafford JM, Jarrett BR, Miranda-Dominguez O, Mills BD, Cain N, Mihalas S, et al. (2014): Large-scale topology and the default mode network in the mouse connectome. Proceedings of the National Academy of Sciences 111:18745–18750. [DOI] [PMC free article] [PubMed] [Google Scholar]
- 35.Grandjean J, Zerbi V, Balsters JH, Wenderoth N, Rudin M (2017): Structural Basis of Large-Scale Functional Connectivity in the Mouse. The Journal of Neuroscience 37:8092–8101. [DOI] [PMC free article] [PubMed] [Google Scholar]
- 36.van den Heuvel MP, Bullmore ET, Sporns O (2016): Comparative Connectomics. Trends Cogn Sci 20:345–361. [DOI] [PubMed] [Google Scholar]
- 37.Betzel RF, Bassett DS (2018): Specificity and robustness of long-distance connections in weighted, interareal connectomes. Proc Natl Acad Sci U S A 115:E4880–E4889. [DOI] [PMC free article] [PubMed] [Google Scholar]
- 38.Friston KJ, Frith CD, Frackowiak RSJ (1993): Time-dependent changes in effective connectivity measured with PET. Human Brain Mapping 1:69–79. [Google Scholar]
- 39.Mukherjee P, Berman JI, Chung SW, Hess CP, Henry RG (2008): Diffusion tensor MR imaging and fiber tractography: theoretic underpinnings. AJNR Am J Neuroradiol 29:632–641. [DOI] [PMC free article] [PubMed] [Google Scholar]
- 40.Friston KJ (2011): Functional and effective connectivity: a review. Brain Connect 1:13–36. [DOI] [PubMed] [Google Scholar]
- 41.Hallett M, Di Iorio R, Rossini PM, Park JE, Chen R, Celnik P, et al. (2017): Contribution of transcranial magnetic stimulation to assessment of brain connectivity and networks. Clin Neurophysiol 128:2125–2139. [DOI] [PMC free article] [PubMed] [Google Scholar]
- 42.Keller CJ, Honey CJ, Megevand P, Entz L, Ulbert I, Mehta AD (2014): Mapping human brain networks with cortico-cortical evoked potentials. Philos Trans R Soc Lond B Biol Sci 369. [DOI] [PMC free article] [PubMed] [Google Scholar]
- 43.Fox KCR, Foster BL, Kucyi A, Daitch AL, Parvizi J (2018): Intracranial Electrophysiology of the Human Default Network. Trends Cogn Sci 22:307–324. [DOI] [PMC free article] [PubMed] [Google Scholar]
- 44.Donos C, Maliia MD, Mindruta I, Popa I, Ene M, Balanescu B, et al. (2016): A connectomics approach combining structural and effective connectivity assessed by intracranial electrical stimulation. Neuroimage 132:344–358. [DOI] [PubMed] [Google Scholar]
- 45.Tolias AS, Sultan F, Augath M, Oeltermann A, Tehovnik EJ, Schiller PH, et al. (2005): Mapping cortical activity elicited with electrical microstimulation using FMRI in the macaque. Neuron 48:901–911. [DOI] [PubMed] [Google Scholar]
- 46.Ryali S, Shih YI, Chen T, Kochalka J, Albaugh D, Fang Z, et al. (2016): Combining optogenetic stimulation and fMRI to validate a multivariate dynamical systems model for estimating causal brain interactions. Neuroimage 132:398–405. [DOI] [PMC free article] [PubMed] [Google Scholar]
- 47.Boyden ES, Zhang F, Bamberg E, Nagel G, Deisseroth K (2005): Millisecond-timescale, genetically targeted optical control of neural activity. Nature neuroscience 8:1263–1268. [DOI] [PubMed] [Google Scholar]
- 48.Nagel G, Szellas T, Huhn W, Kateriya S, Adeishvili N, Berthold P, et al. (2003): Channelrhodopsin-2, a directly light-gated cation-selective membrane channel. Proceedings of the National Academy of Sciences 100:13940. [DOI] [PMC free article] [PubMed] [Google Scholar]
- 49.Chow BY, Han X, Boyden ES (2012): Chapter 3 - Genetically encoded molecular tools for light-driven silencing of targeted neurons. In: Knöpfel T, Boyden ES, editors. Progress in Brain Research: Elsevier, pp 49–61. [DOI] [PMC free article] [PubMed] [Google Scholar]
- 50.Zhang F, Wang LP, Boyden ES, Deisseroth K (2006): Channelrhodopsin-2 and optical control of excitable cells. Nature methods 3:785–792. [DOI] [PubMed] [Google Scholar]
- 51.Petreanu L, Huber D, Sobczyk A, Svoboda K (2007): Channelrhodopsin-2-assisted circuit mapping of long-range callosal projections. Nature neuroscience 10:663–668. [DOI] [PubMed] [Google Scholar]
- 52.Arenkiel BR, Peca J, Davison IG, Feliciano C, Deisseroth K, Augustine GJ, et al. (2007): In vivo light-induced activation of neural circuitry in transgenic mice expressing channelrhodopsin-2. Neuron 54:205–218. [DOI] [PMC free article] [PubMed] [Google Scholar]
- 53.Tye KM, Deisseroth K (2012): Optogenetic investigation of neural circuits underlying brain disease in animal models. Nature Reviews Neuroscience 13:251. [DOI] [PMC free article] [PubMed] [Google Scholar]
- 54.Lin JY, Knutsen PM, Muller A, Kleinfeld D, Tsien RY (2013): ReaChR: a red-shifted variant of channelrhodopsin enables deep transcranial optogenetic excitation. Nature neuroscience 16:1499. [DOI] [PMC free article] [PubMed] [Google Scholar]
- 55.Klapoetke NC, Murata Y, Kim SS, Pulver SR, Birdsey-Benson A, Cho YK, et al. (2014): Independent Optical Excitation of Distinct Neural Populations. Nature methods 11:338–346. [DOI] [PMC free article] [PubMed] [Google Scholar]
- 56.Lin JY, Lin MZ, Steinbach P, Tsien RY (2009): Characterization of Engineered Channelrhodopsin Variants with Improved Properties and Kinetics. Biophysical Journal 96:1803–1814. [DOI] [PMC free article] [PubMed] [Google Scholar]
- 57.Mattis J, Tye KM, Ferenczi EA, Ramakrishnan C, O’Shea DJ, Prakash R, et al. (2011): Principles for applying optogenetic tools derived from direct comparative analysis of microbial opsins. Nature methods 9:159. [DOI] [PMC free article] [PubMed] [Google Scholar]
- 58.Fenno L, Yizhar O, Deisseroth K (2011): The Development and Application of Optogenetics. Annu Rev Neurosci 34:389–412. [DOI] [PMC free article] [PubMed] [Google Scholar]
- 59.Han X, Qian X, Bernstein JG, Zhou H-h, Franzesi GT, Stern P, et al. (2009): Millisecond-Timescale Optical Control of Neural Dynamics in the Nonhuman Primate Brain. Neuron 62:191–198. [DOI] [PMC free article] [PubMed] [Google Scholar]
- 60.Galvan A, Caiola MJ, Albaugh DL (2018): Advances in optogenetic and chemogenetic methods to study brain circuits in non-human primates. Journal of Neural Transmission 125:547–563. [DOI] [PMC free article] [PubMed] [Google Scholar]
- 61.Avermann M, Tomm C, Mateo C, Gerstner W, Petersen CC (2012): Microcircuits of excitatory and inhibitory neurons in layer 2/3 of mouse barrel cortex. J Neurophysiol 107:3116–3134. [DOI] [PubMed] [Google Scholar]
- 62.Mao T, Kusefoglu D, Hooks Bryan M, Huber D, Petreanu L, Svoboda K (2011): Long-Range Neuronal Circuits Underlying the Interaction between Sensory and Motor Cortex. Neuron 72:111–123. [DOI] [PMC free article] [PubMed] [Google Scholar]
- 63.Hira R, Honkura N, Noguchi J, Maruyama Y, Augustine GJ, Kasai H, et al. (2009): Transcranial optogenetic stimulation for functional mapping of the motor cortex. Journal of Neuroscience Methods 179:258–263. [DOI] [PubMed] [Google Scholar]
- 64.Ayling OG, Harrison TC, Boyd JD, Goroshkov A, Murphy TH (2009): Automated light-based mapping of motor cortex by photoactivation of channelrhodopsin-2 transgenic mice. Nature methods 6:219–224. [DOI] [PubMed] [Google Scholar]
- 65.Harrison TC, Silasi G, Boyd JD, Murphy TH (2013): Displacement of sensory maps and disorganization of motor cortex after targeted stroke in mice. Stroke 44:2300–2306. [DOI] [PubMed] [Google Scholar]
- 66.Harrison Thomas C, Ayling Oliver GS, Murphy Timothy H (2012): Distinct Cortical Circuit Mechanisms for Complex Forelimb Movement and Motor Map Topography. Neuron 74:397–409. [DOI] [PubMed] [Google Scholar]
- 67.Sreenivasan V, Karmakar K, Rijli Filippo M, Petersen Carl CH (2014): Parallel pathways from motor and somatosensory cortex for controlling whisker movements in mice. European Journal of Neuroscience 41:354–367. [DOI] [PMC free article] [PubMed] [Google Scholar]
- 68.Lim DH, LeDue JM, Mohajerani MH, Murphy TH (2014): Optogenetic mapping after stroke reveals network-wide scaling of functional connections and heterogeneous recovery of the peri-infarct. J Neurosci 34:16455–16466. [DOI] [PMC free article] [PubMed] [Google Scholar]
- 69.Lim DH, Mohajerani MH, Ledue J, Boyd J, Chen S, Murphy TH (2012): In vivo Large-Scale Cortical Mapping Using Channelrhodopsin-2 Stimulation in Transgenic Mice Reveals Asymmetric and Reciprocal Relationships between Cortical Areas. Frontiers in neural circuits 6:11. [DOI] [PMC free article] [PubMed] [Google Scholar]
- 70.Bovetti S, Moretti C, Zucca S, Dal Maschio M, Bonifazi P, Fellin T (2017): Simultaneous high-speed imaging and optogenetic inhibition in the intact mouse brain. Scientific Reports 7:40041. [DOI] [PMC free article] [PubMed] [Google Scholar]
- 71.Akerboom J, Carreras Calderón N, Tian L, Wabnig S, Prigge M, Tolö J, et al. (2013): Genetically encoded calcium indicators for multi-color neural activity imaging and combination with optogenetics. Frontiers in Molecular Neuroscience 6. [DOI] [PMC free article] [PubMed] [Google Scholar]
- 72.Bauer AQ, Kraft AW, Baxter GA, Wright PW, Reisman MD, Bice AR, et al. (2018): Effective Connectivity Measured Using Optogenetically Evoked Hemodynamic Signals Exhibits Topography Distinct from Resting State Functional Connectivity in the Mouse. Cereb Cortex 28:370–386. [DOI] [PMC free article] [PubMed] [Google Scholar]
- 73.Desai M, Kahn I, Knoblich U, Bernstein J, Atallah H, Yang A, et al. (2011): Mapping brain networks in awake mice using combined optical neural control and fMRI. J Neurophysiol 105:1393–1405. [DOI] [PMC free article] [PubMed] [Google Scholar]
- 74.Lee JH, Durand R, Gradinaru V, Zhang F, Goshen I, Kim DS, et al. (2010): Global and local fMRI signals driven by neurons defined optogenetically by type and wiring. Nature 465:788–792. [DOI] [PMC free article] [PubMed] [Google Scholar]
- 75.Giorgi A, Migliarini S, Galbusera A, Maddaloni G, Mereu M, Margiani G, et al. (2017): Brain-wide Mapping of Endogenous Serotonergic Transmission via Chemogenetic fMRI. Cell Reports 21:910–918. [DOI] [PubMed] [Google Scholar]
- 76.Grayson DS, Bliss-Moreau E, Machado CJ, Bennett J, Shen K, Grant KA, et al. (2016): The Rhesus Monkey Connectome Predicts Disrupted Functional Networks Resulting from Pharmacogenetic Inactivation of the Amygdala. Neuron 91:453–466. [DOI] [PMC free article] [PubMed] [Google Scholar]
- 77.Roth BL (2016): DREADDs for Neuroscientists. Neuron 89:683–694. [DOI] [PMC free article] [PubMed] [Google Scholar]
- 78.Kahn I, Desai M, Knoblich U, Bernstein J, Henninger M, Graybiel AM, et al. (2011): Characterization of the functional MRI response temporal linearity via optical control of neocortical pyramidal neurons. J Neurosci 31:15086–15091. [DOI] [PMC free article] [PubMed] [Google Scholar]
- 79.Anenberg E, Chan AW, Xie Y, LeDue JM, Murphy TH (2015): Optogenetic stimulation of GABA neurons can decrease local neuronal activity while increasing cortical blood flow. Journal of cerebral blood flow and metabolism : official journal of the International Society of Cerebral Blood Flow and Metabolism 35:1579–1586. [DOI] [PMC free article] [PubMed] [Google Scholar]
- 80.Scott NA, Murphy TH (2012): Hemodynamic Responses Evoked by Neuronal Stimulation via Channelrhodopsin-2 Can Be Independent of Intracortical Glutamatergic Synaptic Transmission. PloS one 7:e29859. [DOI] [PMC free article] [PubMed] [Google Scholar]
- 81.Iordanova B, Vazquez AL, Poplawsky AJ, Fukuda M, Kim SG (2015): Neural and hemodynamic responses to optogenetic and sensory stimulation in the rat somatosensory cortex. Journal of cerebral blood flow and metabolism : official journal of the International Society of Cerebral Blood Flow and Metabolism 35:922–932. [DOI] [PMC free article] [PubMed] [Google Scholar]
- 82.Vazquez AL, Fukuda M, Crowley JC, Kim S-G (2014): Neural and Hemodynamic Responses Elicited by Forelimb-and Photo-stimulation in Channelrhodopsin-2 Mice: Insights into the Hemodynamic Point Spread Function. Cereb Cortex 24:2908–2919. [DOI] [PMC free article] [PubMed] [Google Scholar]
- 83.Sirotin YB, Hillman EMC, Bordier C, Das A (2009): Spatiotemporal precision and hemodynamic mechanism of optical point spreads in alert primates. Proceedings of the National Academy of Sciences 106:18390. [DOI] [PMC free article] [PubMed] [Google Scholar]
- 84.Frostig RD, Lieke EE, Ts o DY, Grinvald A (1990): Cortical functional architecture and local coupling between neuronal activity and the microcirculation revealed by in vivo high-resolution optical imaging of intrinsic signals. Proceedings of the National Academy of Sciences 87:6082. [DOI] [PMC free article] [PubMed] [Google Scholar]
- 85.Grinvald A, Lieke E, Frostig RD, Gilbert CD, Wiesel TN (1986): Functional architecture of cortex revealed by optical imaging of intrinsic signals. Nature 324:361–364. [DOI] [PubMed] [Google Scholar]
- 86.Mohajerani MH, McVea DA, Fingas M, Murphy TH (2010): Mirrored bilateral slow-wave cortical activity within local circuits revealed by fast bihemispheric voltage-sensitive dye imaging in anesthetized and awake mice. J Neurosci 30:3745–3751. [DOI] [PMC free article] [PubMed] [Google Scholar]
- 87.Honey CJ, Sporns O, Cammoun L, Gigandet X, Thiran JP, Meuli R, et al. (2009): Predicting human resting-state functional connectivity from structural connectivity. Proceedings of the National Academy of Sciences 106:2035–2040. [DOI] [PMC free article] [PubMed] [Google Scholar]
- 88.Poulet JFA, Fernandez LMJ, Crochet S, Petersen CCH (2012): Thalamic control of cortical states. Nature neuroscience 15:370–372. [DOI] [PubMed] [Google Scholar]
- 89.Leong AT, Chan RW, Gao PP, Chan YS, Tsia KK, Yung WH, et al. (2016): Long-range projections coordinate distributed brain-wide neural activity with a specific spatiotemporal profile. Proc Natl Acad Sci U S A 113:E8306–E8315. [DOI] [PMC free article] [PubMed] [Google Scholar]
- 90.Chan RW, Leong ATL, Ho LC, Gao PP, Wong EC, Dong CM, et al. (2017): Low-frequency hippocampal-cortical activity drives brain-wide resting-state functional MRI connectivity. Proc Natl Acad Sci U S A 114:E6972–E6981. [DOI] [PMC free article] [PubMed] [Google Scholar]
- 91.Oh SW, Harris JA, Ng L, Winslow B, Cain N, Mihalas S, et al. (2014): A mesoscale connectome of the mouse brain. Nature 508:207–214. [DOI] [PMC free article] [PubMed] [Google Scholar]
- 92.Ferezou I, Haiss F, Gentet LJ, Aronoff R, Weber B, Petersen CCH (2007): Spatiotemporal Dynamics of Cortical Sensorimotor Integration in Behaving Mice. Neuron 56:907–923. [DOI] [PubMed] [Google Scholar]
- 93.Mao T, Kusefoglu D, Hooks BM, Huber D, Petreanu L, Svoboda K (2011): Long-range neuronal circuits underlying the interaction between sensory and motor cortex. Neuron 72:111–123. [DOI] [PMC free article] [PubMed] [Google Scholar]
- 94.Matsui T, Tamura K, Koyano KW, Takeuchi D, Adachi Y, Osada T, et al. (2011): Direct comparison of spontaneous functional connectivity and effective connectivity measured by intracortical microstimulation: an fMRI study in macaque monkeys. Cereb Cortex 21:2348–2356. [DOI] [PubMed] [Google Scholar]
- 95.Buzsáki G, Moser EI (2013): Memory, navigation and theta rhythm in the hippocampal-entorhinal system. Nature neuroscience 16:130. [DOI] [PMC free article] [PubMed] [Google Scholar]
- 96.Hahn TT, Sakmann B, Mehta MR (2007): Differential responses of hippocampal subfields to cortical up-down states. Proc Natl Acad Sci U S A 104:5169–5174. [DOI] [PMC free article] [PubMed] [Google Scholar]
- 97.Sherman SM, Guillery RW (1996): Functional organization of thalamocortical relays. Journal of Neurophysiology 76:1367–1395. [DOI] [PubMed] [Google Scholar]
- 98.Schiff Nicholas D (2008): Central Thalamic Contributions to Arousal Regulation and Neurological Disorders of Consciousness. Annals of the New York Academy of Sciences 1129:105–118. [DOI] [PubMed] [Google Scholar]
- 99.Liu J, Lee HJ, Weitz AJ, Fang Z, Lin P, Choy M, et al. (2015): Frequency-selective control of cortical and subcortical networks by central thalamus. Elife 4:e09215. [DOI] [PMC free article] [PubMed] [Google Scholar]
- 100.Weitz AJ, Fang Z, Lee HJ, Fisher RS, Smith WC, Choy M, et al. (2015): Optogenetic fMRI reveals distinct, frequency-dependent networks recruited by dorsal and intermediate hippocampus stimulations. NeuroImage 107:229–241 [DOI] [PMC free article] [PubMed] [Google Scholar]
- 101.Barker AT, Jalinous R, Freeston IL (1985): Non-invasive magnetic stimulation of human motor cortex. Lancet 1:1106–1107. [DOI] [PubMed] [Google Scholar]
- 102.Hallett M (2007): Transcranial magnetic stimulation: a primer. Neuron 55:187–199. [DOI] [PubMed] [Google Scholar]
- 103.Hoogendam JM, Ramakers GM, Di Lazzaro V (2010): Physiology of repetitive transcranial magnetic stimulation of the human brain. Brain Stimul 3:95–118. [DOI] [PubMed] [Google Scholar]
- 104.Huang YZ, Edwards MJ, Rounis E, Bhatia KP, Rothwell JC (2005): Theta burst stimulation of the human motor cortex. Neuron 45:201–206. [DOI] [PubMed] [Google Scholar]
- 105.Allen EA, Pasley BN, Duong T, Freeman RD (2007): Transcranial magnetic stimulation elicits coupled neural and hemodynamic consequences. Science 317:1918–1921. [DOI] [PubMed] [Google Scholar]
- 106.Valero-Cabre A, Payne BR, Rushmore J, Lomber SG, Pascual-Leone A (2005): Impact of repetitive transcranial magnetic stimulation of the parietal cortex on metabolic brain activity: a 14C-2DG tracing study in the cat. Exp Brain Res 163:1–12. [DOI] [PubMed] [Google Scholar]
- 107.Salinas FS, Szabo CA, Zhang W, Jones L, Leland MM, Wey HY, et al. (2011): Functional neuroimaging of the baboon during concurrent image-guided transcranial magnetic stimulation. Neuroimage 57:1393–1401. [DOI] [PMC free article] [PubMed] [Google Scholar]
- 108.Gratton C, Lee TG, Nomura EM, D’Esposito M (2014): Perfusion MRI indexes variability in the functional brain effects of theta-burst transcranial magnetic stimulation. PloS one 9:e101430. [DOI] [PMC free article] [PubMed] [Google Scholar]
- 109.Chiang TC, Vaithianathan T, Leung T, Lavidor M, Walsh V, Delpy DT (2007): Elevated haemoglobin levels in the motor cortex following 1 Hz transcranial magnetic stimulation: a preliminary study. Exp Brain Res 181:555–560. [DOI] [PubMed] [Google Scholar]
- 110.Pasley BN, Allen EA, Freeman RD (2009): State-dependent variability of neuronal responses to transcranial magnetic stimulation of the visual cortex. Neuron 62:291–303. [DOI] [PMC free article] [PubMed] [Google Scholar]
- 111.Ruff CC, Driver J, Bestmann S (2009): Combining TMS and fMRI: from ‘virtual lesions’ to functional-network accounts of cognition. Cortex 45:1043–1049. [DOI] [PMC free article] [PubMed] [Google Scholar]
- 112.Rahnev D, Kok P, Munneke M, Bahdo L, de Lange FP, Lau H (2013): Continuous theta burst transcranial magnetic stimulation reduces resting state connectivity between visual areas. J Neurophysiol 110:1811–1821. [DOI] [PubMed] [Google Scholar]
- 113.Cohen LG, Celnik P, Pascual-Leone A, Corwell B, Falz L, Dambrosia J, et al. (1997): Functional relevance of cross-modal plasticity in blind humans. Nature 389:180–183. [DOI] [PubMed] [Google Scholar]
- 114.Lowe CJ, Manocchio F, Safati AB, Hall PA (2018): The effects of theta burst stimulation (TBS) targeting the prefrontal cortex on executive functioning: A systematic review and meta-analysis. Neuropsychologia 111:344–359. [DOI] [PubMed] [Google Scholar]
- 115.Wang JX, Rogers LM, Gross EZ, Ryals AJ, Dokucu ME, Brandstatt KL, et al. (2014): Targeted enhancement of cortical-hippocampal brain networks and associative memory. Science 345:1054–1057. [DOI] [PMC free article] [PubMed] [Google Scholar]
- 116.Bodart O, Amico E, Gomez F, Casali AG, Wannez S, Heine L, et al. (2018): Global structural integrity and effective connectivity in patients with disorders of consciousness. Brain Stimul 11:358–365. [DOI] [PubMed] [Google Scholar]
- 117.Marshall TR, O’Shea J, Jensen O, Bergmann TO (2015): Frontal eye fields control attentional modulation of alpha and gamma oscillations in contralateral occipitoparietal cortex. J Neurosci 35:1638–1647. [DOI] [PMC free article] [PubMed] [Google Scholar]
- 118.Siebner HR, Bergmann TO, Bestmann S, Massimini M, Johansen-Berg H, Mochizuki H, et al. (2009): Consensus paper: combining transcranial stimulation with neuroimaging. Brain Stimul 2:58–80. [DOI] [PubMed] [Google Scholar]
- 119.Groiss SJ, Mochizuki H, Furubayashi T, Kobayashi S, Nakatani-Enomoto S, Nakamura K, et al. (2013): Quadri-pulse stimulation induces stimulation frequency dependent cortical hemoglobin concentration changes within the ipsilateral motor cortical network. Brain Stimul 6:40–48. [DOI] [PubMed] [Google Scholar]
- 120.Ruff CC, Blankenburg F, Bjoertomt O, Bestmann S, Freeman E, Haynes JD, et al. (2006): Concurrent TMS-fMRI and psychophysics reveal frontal influences on human retinotopic visual cortex. Curr Biol 16:1479–1488. [DOI] [PubMed] [Google Scholar]
- 121.Bergmann TO, Karabanov A, Hartwigsen G, Thielscher A, Siebner HR (2016): Combining non-invasive transcranial brain stimulation with neuroimaging and electrophysiology: Current approaches and future perspectives. Neuroimage 140:4–19. [DOI] [PubMed] [Google Scholar]
- 122.Massimini M, Ferrarelli F, Sarasso S, Tononi G (2012): Cortical mechanisms of loss of consciousness: insight from TMS/EEG studies. Arch Ital Biol 150:44–55. [DOI] [PubMed] [Google Scholar]
- 123.Reithler J, Peters JC, Sack AT (2011): Multimodal transcranial magnetic stimulation: using concurrent neuroimaging to reveal the neural network dynamics of noninvasive brain stimulation. Prog Neurobiol 94:149–165. [DOI] [PubMed] [Google Scholar]
- 124.Driver J, Blankenburg F, Bestmann S, Vanduffel W, Ruff CC (2009): Concurrent brain-stimulation and neuroimaging for studies of cognition. Trends Cogn Sci 13:319–327. [DOI] [PubMed] [Google Scholar]
- 125.Blankenburg F, Ruff CC, Bestmann S, Bjoertomt O, Eshel N, Josephs O, et al. (2008): Interhemispheric effect of parietal TMS on somatosensory response confirmed directly with concurrent TMS-fMRI. J Neurosci 28:13202–13208. [DOI] [PMC free article] [PubMed] [Google Scholar]
- 126.Bestmann S, Swayne O, Blankenburg F, Ruff CC, Haggard P, Weiskopf N, et al. (2008): Dorsal premotor cortex exerts state-dependent causal influences on activity in contralateral primary motor and dorsal premotor cortex. Cereb Cortex 18:1281–1291. [DOI] [PMC free article] [PubMed] [Google Scholar]
- 127.Fox MD, Buckner RL, Liu H, Chakravarty MM, Lozano AM, Pascual-Leone A (2014): Resting-state networks link invasive and noninvasive brain stimulation across diverse psychiatric and neurological diseases. Proc Natl Acad Sci U S A 111:E4367–4375. [DOI] [PMC free article] [PubMed] [Google Scholar]
- 128.Nowak DA, Bosl K, Podubecka J, Carey JR (2010): Noninvasive brain stimulation and motor recovery after stroke. Restor Neurol Neurosci 28:531–544. [DOI] [PubMed] [Google Scholar]
- 129.de Hemptinne C, Swann NC, Ostrem JL, Ryapolova-Webb ES, San Luciano M, Galifianakis NB, et al. (2015): Therapeutic deep brain stimulation reduces cortical phase-amplitude coupling in Parkinson’s disease. Nature neuroscience 18:779–786. [DOI] [PMC free article] [PubMed] [Google Scholar]
- 130.Lefaucheur JP (2009): Treatment of Parkinson’s disease by cortical stimulation. Expert Rev Neurother 9:1755–1771. [DOI] [PubMed] [Google Scholar]
- 131.Philip NS, Barredo J, Aiken E, Carpenter LL (2018): Neuroimaging Mechanisms of Therapeutic Transcranial Magnetic Stimulation for Major Depressive Disorder. Biol Psychiatry Cogn Neurosci Neuroimaging 3:211–222. [DOI] [PMC free article] [PubMed] [Google Scholar]
- 132.Fox MD, Buckner RL, White MP, Greicius MD, Pascual-Leone A (2012): Efficacy of transcranial magnetic stimulation targets for depression is related to intrinsic functional connectivity with the subgenual cingulate. Biol Psychiatry 72:595–603. [DOI] [PMC free article] [PubMed] [Google Scholar]
- 133.Weigand A, Horn A, Caballero R, Cooke D, Stern AP, Taylor SF, et al. (2018): Prospective Validation That Subgenual Connectivity Predicts Antidepressant Efficacy of Transcranial Magnetic Stimulation Sites. Biol Psychiatry 84:28–37. [DOI] [PMC free article] [PubMed] [Google Scholar]
- 134.Heller AS (2016): Cortical-Subcortical Interactions in Depression: From Animal Models to Human Psychopathology. Front Syst Neurosci 10:20. [DOI] [PMC free article] [PubMed] [Google Scholar]
- 135.Covington HE 3rd, Lobo MK, Maze I, Vialou V, Hyman JM, Zaman S, et al. (2010): Antidepressant effect of optogenetic stimulation of the medial prefrontal cortex. J Neurosci 30:16082–16090. [DOI] [PMC free article] [PubMed] [Google Scholar]
- 136.Nestler EJ, Carlezon WA Jr. (2006): The mesolimbic dopamine reward circuit in depression. Biol Psychiatry 59:1151–1159. [DOI] [PubMed] [Google Scholar]
- 137.Bjorklund A, Dunnett SB (2007): Dopamine neuron systems in the brain: an update. Trends in neurosciences 30:194–202. [DOI] [PubMed] [Google Scholar]
- 138.Lohani S, Poplawsky AJ, Kim SG, Moghaddam B (2016): Unexpected global impact of VTA dopamine neuron activation as measured by opto-fMRI. Molecular Psychiatry 22:585. [DOI] [PMC free article] [PubMed] [Google Scholar]
- 139.Mitra A, Kraft A, Wright P, Acland B, Snyder AZ, Rosenthal Z, et al. (2018): Spontaneous Infra-slow Brain Activity Has Unique Spatiotemporal Dynamics and Laminar Structure. Neuron 98:297–305 e296. [DOI] [PMC free article] [PubMed] [Google Scholar]
Associated Data
This section collects any data citations, data availability statements, or supplementary materials included in this article.