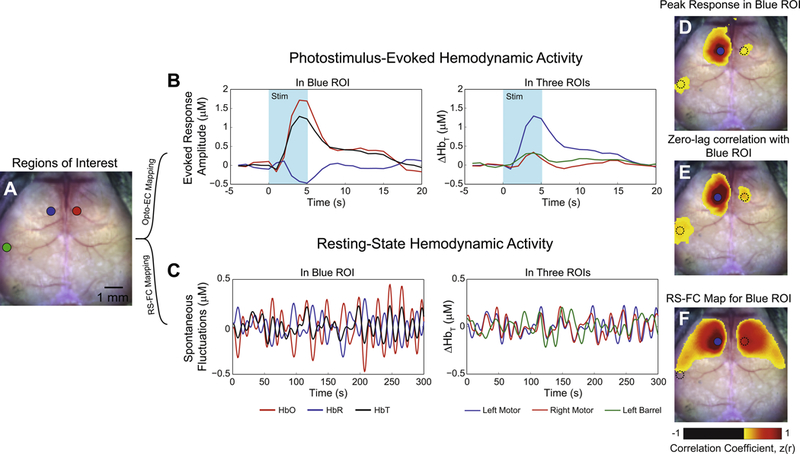
Figure 1. Hemodynamic mapping of brain activity.

A) Dorsal view of the exposed, intact, mouse skull and regions of interest located in left motor (blue), left barrel (green), and right motor (red) cortex for demonstrating Opto-EC and RS-FC mapping strategies. B) Left plot: In transgenic Thy1-ChR2 mice, photostimulation of left motor cortex (473nm laser light, 0.5 mW, 5 ms pulses delivered at 10Hz for 5 seconds) results in local hemodynamic responses in oxygenated (HbO, red), deoxygenated (HbR, blue), and total hemoglobin (HbT, black). A single contrast is chosen for further examination of brain connectivity. In this example, we choose HbT as it is most closely related to underlying neural activity and exhibits the highest contrast to noise. Right plot: In left motor cortex, photostimulus evoked activity (blue trace) simultaneously evolves with distant hemodynamic activity in left barrel (green trace) and contralateral right motor cortex (red trace). C) Left plot: In the absence of any overt stimulus, spontaneous fluctuations of all 3 contrasts can also be measured in the same region. Right plot: Co-fluctuations in the same 3 regions are also observed under resting-state conditions. Notice, however, that spontaneous activity in left (blue) and right (red) motor cortex are approximately in phase while fluctuations in barrel cortex (green) are distinctly less coherent. D) Approximately 5 seconds after photostimulation, a map of peak HbT activity reveals wide spread activity in cortical regions surrounding the site of stimulation (blue dot). Additionally, activity in barrel cortex as well as evoked responses in the homotopic contralateral hemisphere suggests that these satellite regions are functionally-connected to the site interrogated. E) Zero-lag correlation between the region stimulated and all other brain regions produces an Opto-EC map (based on Thy1 excitatory stimulation) for left motor cortex. While topographically similar to the map of peak response in D, the connections with right motor and left barrel are more pronounced. The time courses in left/right motor and left barrel are all approximately in phase, but of different amplitudes; zero-lag correlation analysis is only sensitive to signal timing and immune to amplitude differences (within noise limits). F) Performing the same zero-lag correlation analysis with spontaneous HbT fluctuations in left motor cortex produces a resting state functional connectivity map for the blue region. Distinct topographical differences exist between the RS-FC map and the Opto-EC map. Unlike the Opto-EC map, the RS-FC map is symmetric about midline, and covers large portions of motor cortex and lateral somatosensory cortex. RS-FC between left motor and left barrel is notably absent. Maps in panels D, E, and F are thresholded at a Fisher z(r) value of 0.3. See reference (72) for more methodological details.
