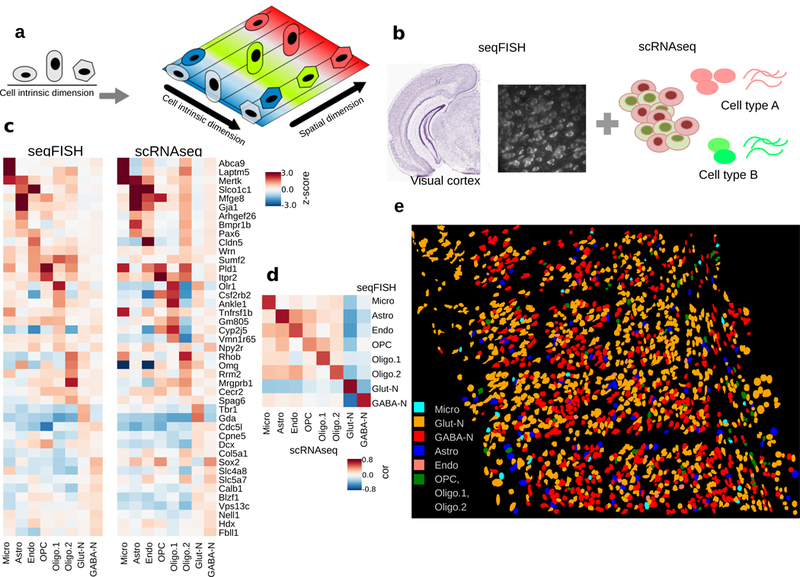
Figure 1:

Overall goal of the project and cell type prediction in seqFISH data.
a. Cellular heterogeneity is driven by both cell-type (indicated by shape) and environmental factors (indicated by colors). ScRNAseq based studies can only detect cell-type related variation, because spatial information is lost.
b. Our goal is to decompose the contributions of each factor by developing methods to integrate scRNAseq and seqFISH data.
c. Prediction results evaluated by the comparison of cell-type average expression profile across technologies for 8 major cell types. Values represent expression z-scores. SVM was tuned for the parameter C, which was set to 1e-5 to optimize the cross-platform cell-type to cell-type correlations. The major cell types in the scRNAseq data set – Astro (n=43 cells), Endo (n=29), GABA-N (n=761), Glut-N (n=812), Micro (n=22), OPC (n=19), Oligo.1 (n=6), and Oligo.2 (n=31) – are mapping to 97, 11, 556, 859, 22, 8, 21, and 23 cells in the seqFISH data set.
d. Pearson correlation between reference and predicted cell type averages ranges from 0.75 to 0.95.
e. Integration of seqFISH and scRNAseq data (illustrated by b) enables cell-type mapping with spatial information in the adult mouse visual cortex. Each cell type is labeled by a different color. Cell shape information is obtained from segmentation of cells from images (see Methods). One mouse brain was assayed by seqFISH due to experimental cost.
