
Figure 2.
Spatial domain dissection in seqFISH data using hidden Markov random field (HMRF) approach.
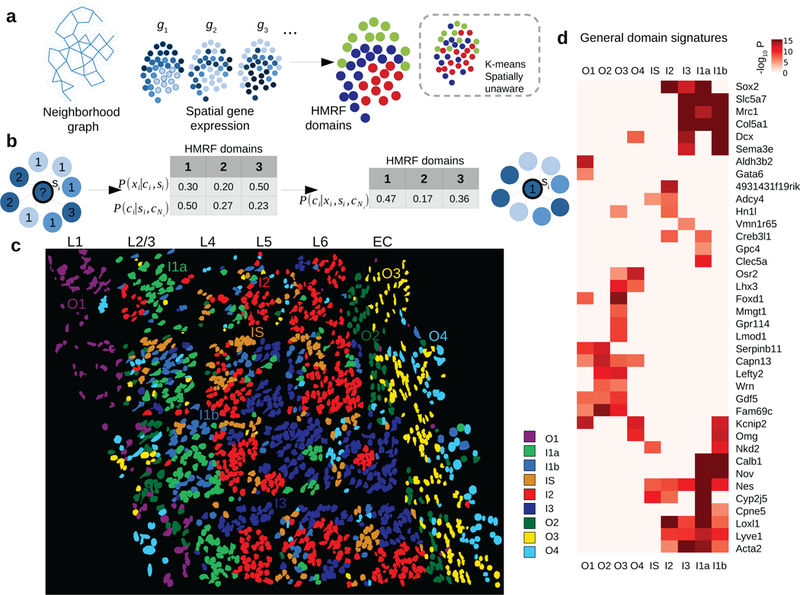
a. A schematic overview of the HMRF model. A neighborhood graph represents the spatial relationship between imaged cells (indicated by the circles) in the seqFISH data. The edges connect cells that are neighboring to each other. seqFISH-detected multigene expression profiles are used together with the graph topology to identify spatial domains. In contrast, k-means and other clustering methods do not utilize spatial information and therefore the results are expected to be less coherent (illustrated in the dashed box).
b. An intuitive illustration of the basic principles in a HMRF model. For a hypothetical cell (indicated by the question mark), its spatial domain assignment is inferred from combining information from gene expression (xi) and neighborhood configuration (cNi). The color of each node represents cell’s expression and the number inside each node is domain number. In this hypothetical example, combining such information results the cell being assigned to domain 1, instead of domain 3 (see Methods).
c. HMRF identifies spatial domain configuration in the mouse visual cortex region. Distinct domains reveal a resemblance to layer organization of cortex. Naming of domains: I1a, I1b, I2, I3 are inner domains distributed in the inner layers. O1-O4 are outer domains. IS is inner scattered state. These domains are associated with cell morphological features such as distinct cell shape differences in outer layer domains. Cell shape information is obtained from segmentation of cells from images (see Methods). For HMRF, 1,000 initial centroids were used and the best centroid was selected to initiate HMRF. HMRF clustering was repeated two more times with similar results.
d. General domain signatures that are shared between cells within domains. P-values signify two-sided Welch’s t-tests with P-values adjusted for multiple comparisons. Genes with significant P-values are shown. All domains are compared: O2 (n=109 cells), I1a (n=389), O4 (n=120), I1b (n=79), O1 (n=135), I2 (n=117), I3 (n=205), O3 (n=270), and IS (n=173).