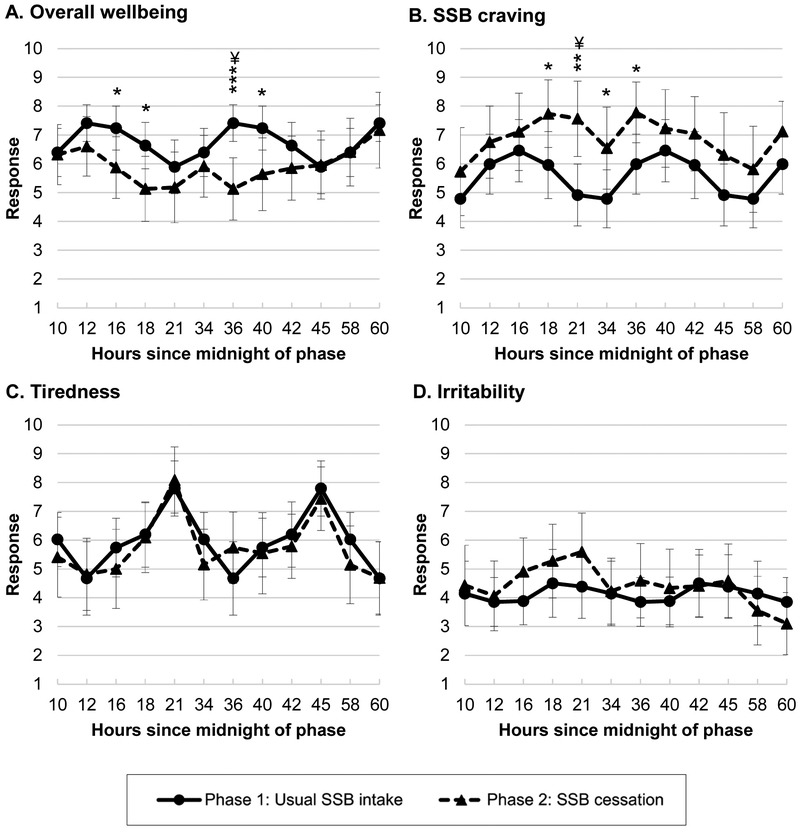
Figure 3. Daily check-in questions assessing symptoms of withdrawal at regular intervals during usual intake and SSB cessation phases (n=24).
*P<0.05, **P<0.01, and ***P<0.01 uncorrected for multiplicity for differences between the usual intake and SSB cessation phases.
¥ Benjamini-Hochberg corrected P-value<0.05.
Plots show average responses at each time point as well as error bars for 95% CIs. CIs and post hoc pairwise contrasts between each time point were estimated using the margins and pwcompare commands in STATA for postestimation after fitting generalized linear regression models containing indicators for each time point with robust (Huber-White sandwich) standard errors. Usual intake phase responses at each time were averaged across days to serve as the comparisons for each time/day of cessation. Full results are reported in Table S2. Questions and 10-point response scale anchors: (A) How do you feel? 1 (really bad) – 10 (really good); (B) How much do you want your favorite sugar-sweetened beverage right now? 1 (I don’t want at all) – (I really want); (C) How tired are you? 1 (not tired at all) – 10 (really tired); (D) How irritable are you? 1 (not at all irritable) – 10 (really irritable).

