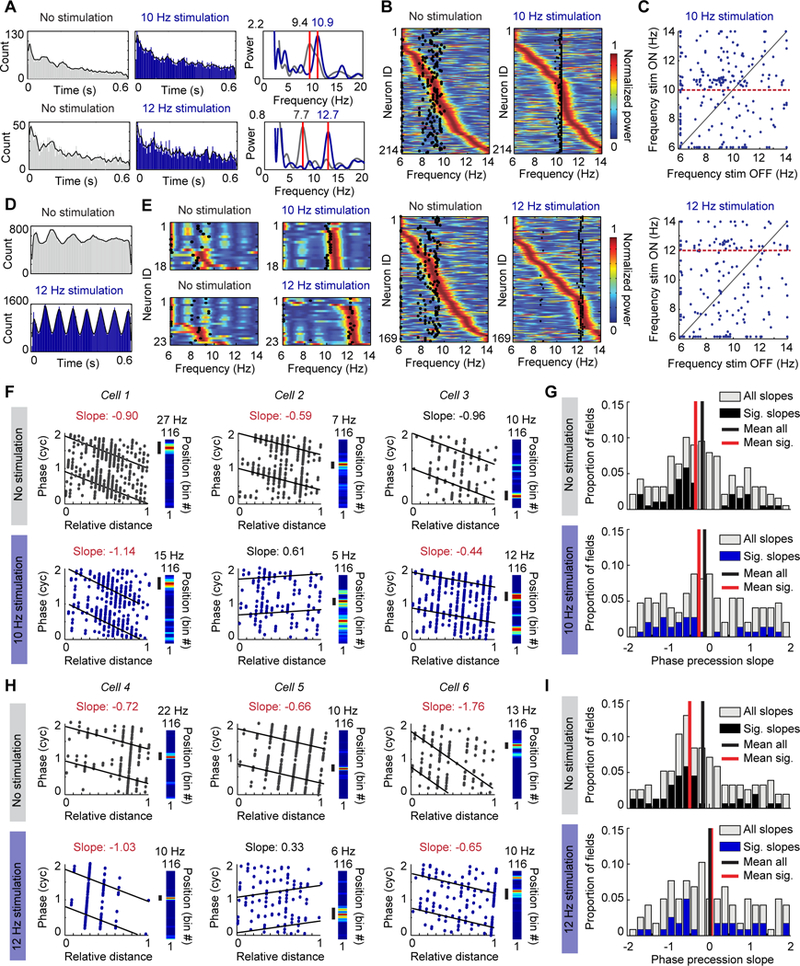
Figure 4. The oscillation frequency of hippocampal neurons is accelerated compared to the LFP frequency during optogenetic pacing of theta-like oscillations.

(A) Left, Spike time autocorrelation of two example cells (grey, no-stimulation laps; blue, stimulation laps). Right, Power calculated from the spike-time autocorrelation of the same cells shows an accelerated frequency compared to the stimulation frequency in the stimulation condition. Variability in spiking occasionally resulted in additional oscillation peaks below the theta range, but peaks within the theta range were consistently observed. (B) Color-coded power (blue to red) calculated from the autocorrelation function of individual pyramidal cells during no-stimulation laps is compared to the mean LFP frequency (black dots). Most cells (i.e., those with peak power to the right of the black dots) were spiking rhythmically at frequencies higher than the LFP frequency during no stimulation laps. During stimulation, the oscillation frequency of a subset of principal cells was accelerated compared to the stimulation frequency. (C) The peak frequency of each cell (blue dots) during no-stimulation laps is plotted against its peak frequency during stimulation laps. The red dotted line highlights the stimulation frequency. (D) Same as A, but for an example interneuron recorded from the CA1 pyramidal cell layer. The rhythmicity of the interneuron was accelerated by the stimulation. (E) Same as B, but for interneurons. Most interneurons were strongly entrained to frequencies higher than the LFP frequency during 10 Hz and 12 Hz stimulation. (F) Phase precession slopes of three example cells during no-stimulation laps (top) and 10 Hz stimulation laps (bottom). Precession was calculated with reference to endogenous frequency during no-stimulation laps and with reference to the paced frequency during stimulation laps. For each cell, the linearized rate map on the track is provided to the right with the field used for calculating phase precession marked by a black bar. Cell 3 is an example of a field that remaps to a new location during stimulation, and where the new field reliably phase precesses. Significantly negative slopes are highlighted by noting the slope in red font. (G) Top, Histogram depicting the slopes of all fields during no-stimulation laps (grey), overlaid with only the significant slopes in black. Bottom, Histogram depicting the slopes of all fields during 10 Hz stimulation laps (grey), overlaid with only the significant slopes in blue. (H, I) Same as F and G but for cells recorded during 12 Hz stimulation sessions.
