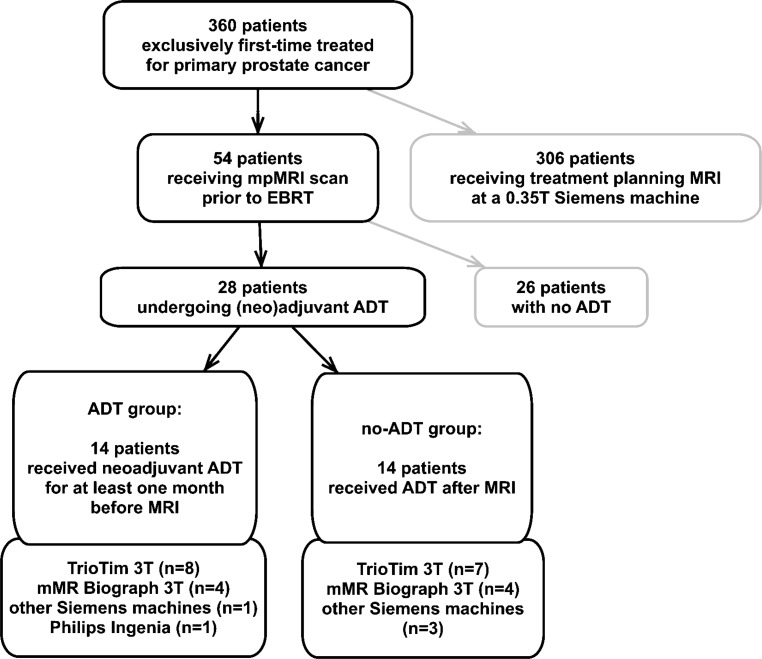
Fig. 1.
Flowchart of the data inclusion process and the assignment to patient subgroups. Grey boxes symbolize patients who were not further analyzed in our study. The MR scanners used for data acquisition (Siemens Healthineers, Erlangen, Germany; Philips Medical Systems, Hamburg, Germany) are listed in the charts attached to the separate subgroups

