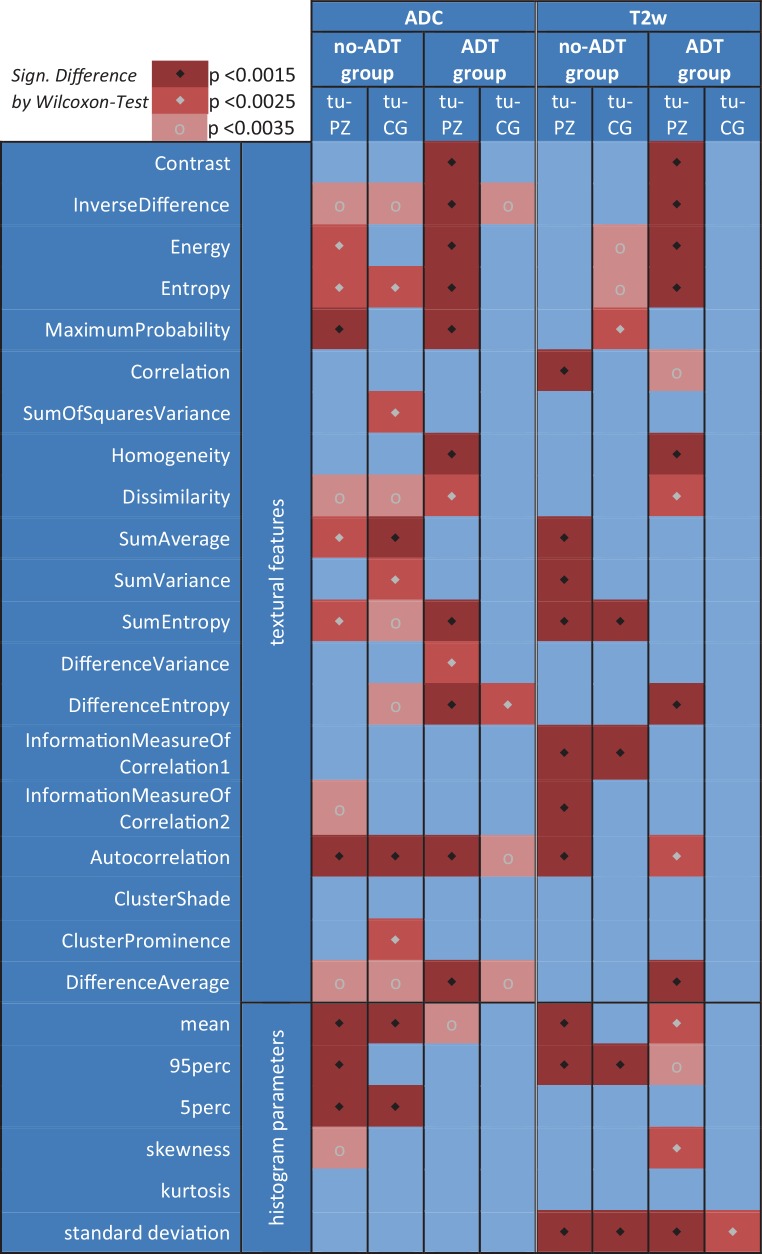
Fig. 2.
Regional comparison of all parameters (textural features and histogram parameters) with different levels of p-value significance. ADC apparent diffusion coefficient, T2w T2 weighted magnetic resonance tomography, ADT androgen deprivation therapy, tu tumor, PZ peripheral zone, CG central gland

