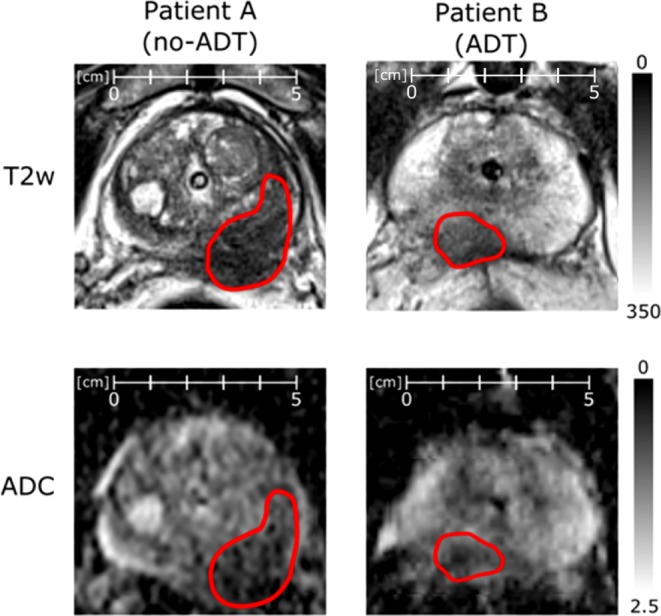
Fig. 3.

Side-by-side comparison of normalized T2w and ADC images of representative patients of each subgroup. Both patients were scanned on a Siemens mMR Biograph. Tumor conspicuity is empirically lower for patient B in both modalities compared to patient A. ADC apparent diffusion coefficient, T2w T2 weighted magnetic resonance tomography, ADT androgen deprivation therapy
