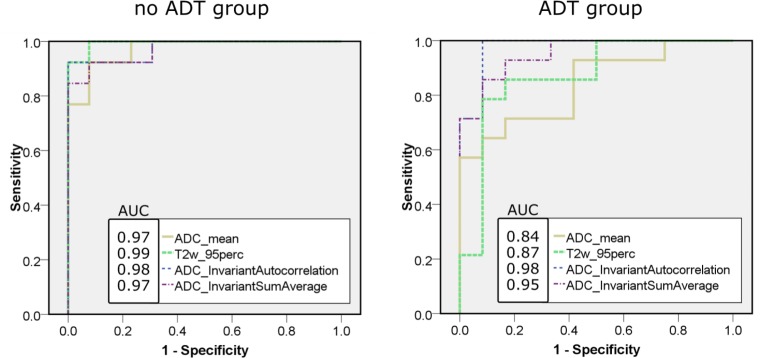
Fig. 4.
ROC curves of the top performing parameters for classifying PZ and lesion: ADC_mean, T2w_95perc (histogram parameters); ADC_Autocorrelation, ADC_Sum Average (TF). Sensitivity and specificity are lower in the ADT group compared to the no-ADT group. TF outperform histogram parameters in the ADT group. ROC curves classifying CG and lesion have a similar appearance. ADC apparent diffusion coefficient, T2w T2 weighted magnetic resonance tomography, ADT androgen deprivation therapy

