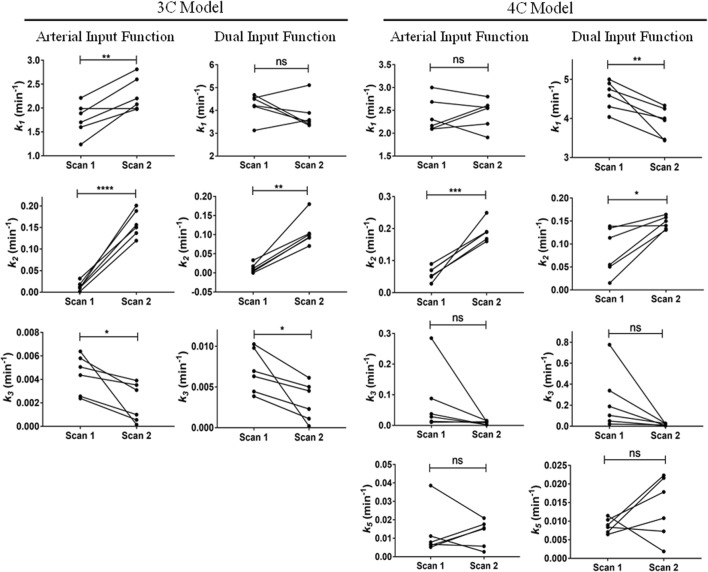
Fig. 3.
Changes in outcome parameters between the first and second scans for the [11C]erlotinib + erlotinib data set. k1, k2, k3, and k5 values obtained in individual subjects for each model in scan 1 and scan 2. ns, not significant; *p ≤ 0.05; **p ≤ 0.01; ***p ≤ 0.005; ****p ≤ 0.0001, two-tailed paired t test

