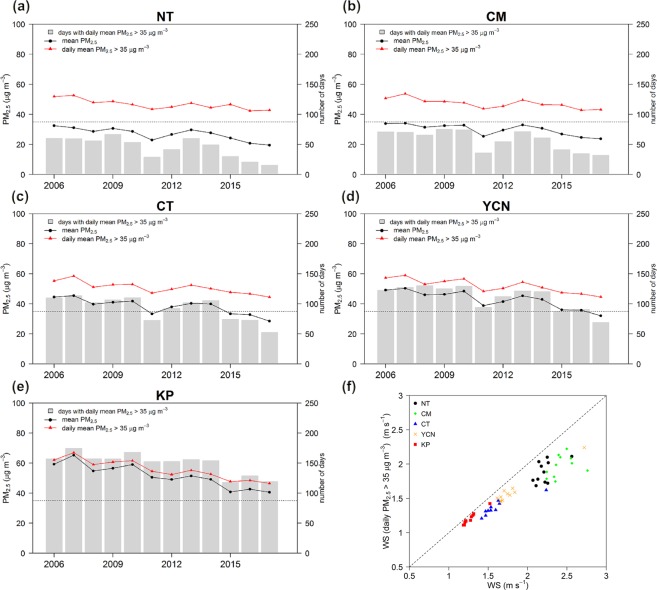
Figure 3.
(a–e) Long-term variations in PM2.5 concentration. The horizontal black dashed line identifies the PM2.5 concentration at 35 μg m−3, black lines denote the mean PM2.5 concentration, and red lines denote the daily mean PM2.5 concentration >35 μg m−3. Gray bars indicate the number of days with a daily mean PM2.5 concentration >35 μg m−3. (f) Annual wind speed comparison between the mean wind speed and the wind speed associated with daily mean PM2.5 concentrations >35 μg m−3.

