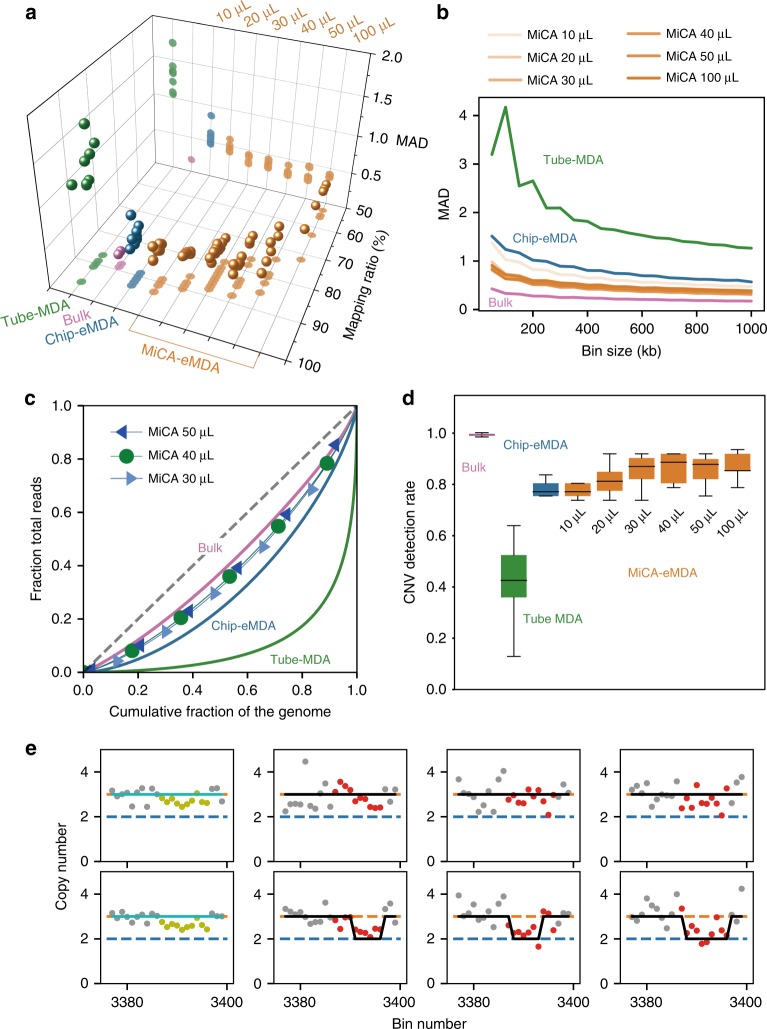
Fig. 4.
The comparison of copy number detection ability between conventional MDA, on-chip eMDA and high-throughput MiCA eMDA. a The MAD and mapping rate for different amplification method. MAD decrease and then increase with enlarging reaction volume, mapping rate dropped with larger reaction volume. b MAD decrease with large bin size on a whole, MiCA are evener than chip-eMDA for all the bin-size tested. c The Lorenz curves of coverage uniformity for single cells amplified by different method compared with unamplified genomic DNA. d The detection rate of copy number change in single HeLa cell compared to unamplified sample. e A region with mean copy number of 2.67 in unamplified sample(two samples on the left), while a 2–3 distribution within single cell samples. Red line showing copy number of 3 and blue line showing copy number of 2, red dots represent the heterogenous region in single cell and yellow for unamplified sample. Black line is the integer copy number determined in single cell and cyan for unamplified sample

