Figure 2.
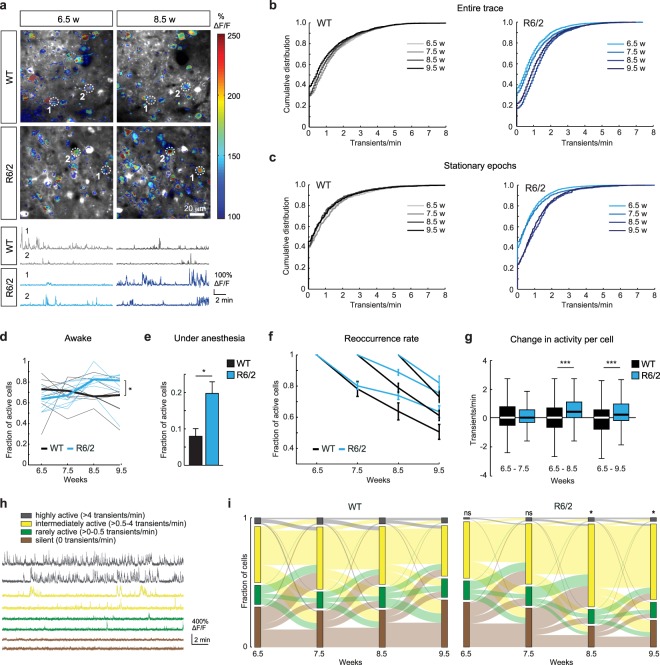
Increased neuronal activity before the onset of motor defects in R6/2 mice. (a) Top: Examples of imaged areas in WT and R6/2 mice superimposed by activity maps. Color coding shows normalized maximum activity. Bottom: Calcium traces of neurons marked on the images above. (b) Cumulative distributions of calcium transient frequencies at the indicated time points in WT (left) and R6/2 (right) animals. Note a shift in the distribution towards higher frequencies occurring at 8.5 weeks in R6/2 mice. (c) Cumulative distributions of calcium transient frequencies during stationary epochs at the indicated time points in WT (left) and R6/2 (right) animals. (d) Fraction of active cells at different imaging time points in WT and R6/2 mice. (e) Fraction of active cells under 1.5% isoflurane anesthesia at 9.5 weeks. (f) Reoccurrence rate of active cells in WT and R6/2 mice. (g) Box plots showing activity changes of single cells between the first and later time points. (h) Example traces of highly active, intermediately active, rarely active and silent neurons. (i) Alluvial plots showing the distribution of imaged cells into four activity categories at each time point (stacked bars), as well as changes between the activity categories over time (stream fields) in WT (left) and R6/2 (right) animals. *p < 0.05, ***p < 0.001.

