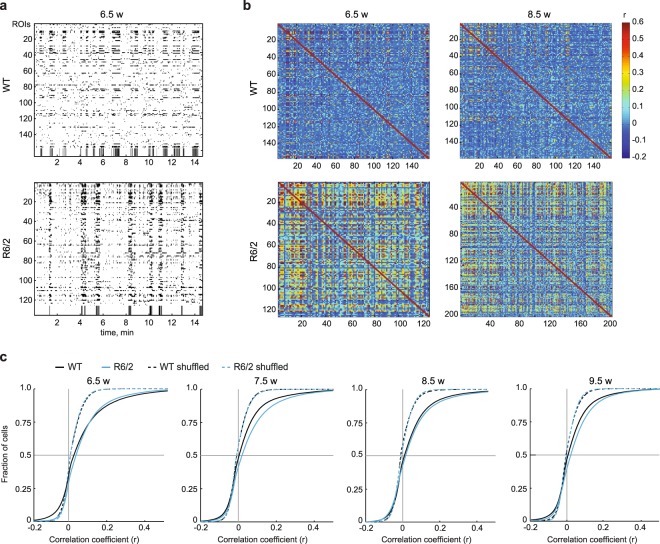
Figure 3.
Increased synchrony in R6/2 mice. (a) Representative raster plots of single-cell activity in a WT (top) and R6/2 (bottom) mouse during an imaging session at 6.5 weeks of age. Running episodes are depicted in black and stationary periods in white at the bottom of the plots. (b) Correlograms from a WT (top) and R6/2 (bottom) mouse shown in (a) at 6.5 weeks (left) and 8.5 weeks (right). Only active cells were included in the analysis, resulting in the different numbers of ROIs captured in the correlograms at different time points. (c) Cumulative distributions of pairwise correlation values (Pearson’s r) for actual (solid lines) and shuffled (dashed lines) data at different time points. Pairwise correlation analysis was performed on entire traces.

