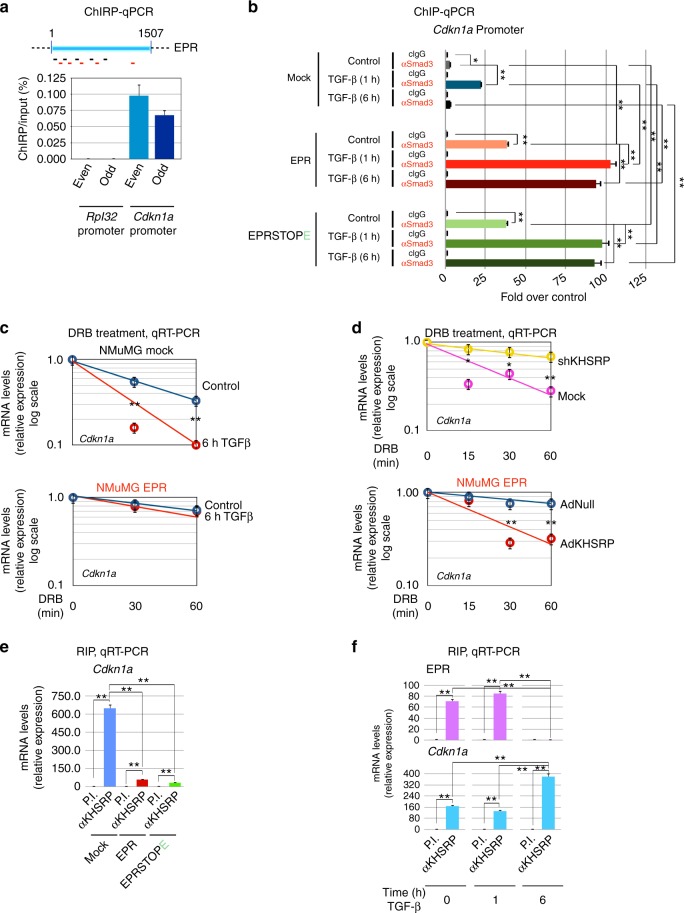
Fig. 5.
EPR associates with Cdkn1a promoter affecting its transcription as well as its mRNA decay. a ChIRP analyses. Top panel is a schematic of EPR and shows the location of biotinylated odd (black) and even (red) tiling oligonucleotides used for ChIRP. Both input and purified DNA were analyzed by qPCR to amplify either Rpl32 (negative control) or Cdkn1a promoters. Values are averages (±SEM) of three independent experiments performed in triplicate. b Chromatin was prepared from either mock, EPR- or EPRSTOPE-overexpressing NMuMG cells serum-starved and either treated with TGF-β (1 ng ml−1) for the indicated times or left untreated (control). Chromatin was immunoprecipitated using either control IgG or affinity-purified anti-SMAD3 rabbit polyclonal antibody. The association of SMAD3 with Cdkn1a promoter was verified by qPCR. c Either mock (top panel) or EPR-overexpressing (bottom panel) NMuMG cells were serum-starved, either treated with TGF-β (10 ng ml−1) for 6 h or left untreated (control) and then treated with 100 μM DRB and total RNA was isolated and analyzed by qRT-PCR to quantify Cdkn1a mRNA levels. d Top panel, either mock or shKHSRP NMuMG cells were treated with 100 μM DRB. Total RNA was isolated at different times (as indicated) and analyzed by qRT-PCR to quantify Cdkn1a mRNA levels. Bottom panel, NMuMG cells stably overexpressing EPR were infected with either control (AdNull) or KHSRP-expressing (AdKHSRP) adenoviral vectors for 24 h then treated with 100 μM DRB. Total RNA was isolated at different times (as indicated) and analyzed by qRT-PCR to quantify Cdkn1a mRNA levels. NMuMG mock cells used for the experiment depicted in the upper panel differ from those presented throughout this report and have been previously described15. e Total extracts from either mock, EPR- or EPRSTOPE-overexpressing NMuMG cells were immunoprecipitated as indicated. RNA was purified from immunocomplexes and analyzed by qRT-PCR to quantify Cdkn1a mRNA levels. f Total extracts were prepared from NMuMG cells serum-starved and either treated with TGF-β (10 ng ml−1) or left untreated (time 0) and immunoprecipitated as indicated. RNA was purified from immunocomplexes and analyzed by qRT-PCR. The values of both qRT-PCR and qPCR experiments shown are averages (±SEM) of three independent experiments performed in triplicate. Statistical significance: *p < 0.01, **p < 0.001 (Student’s t test)

