Fig. 1.
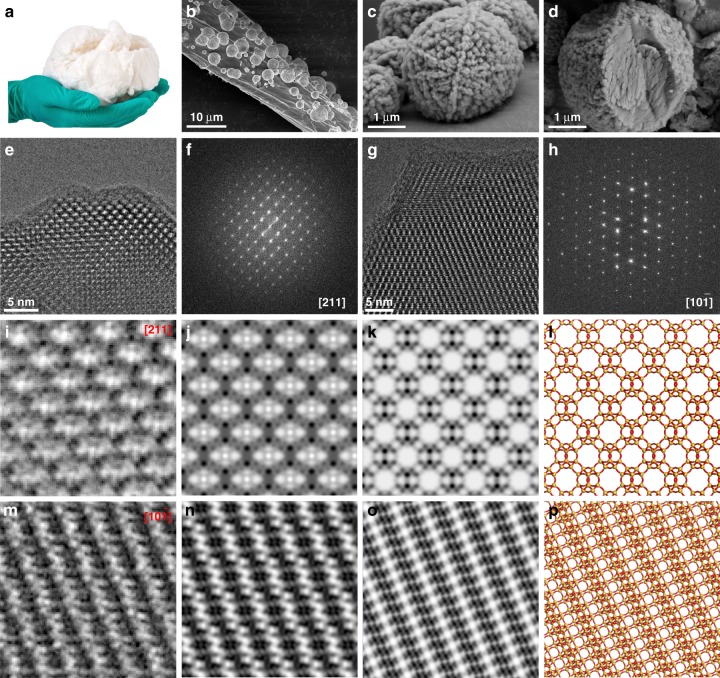
Characterization of mCHA-C. a Photograph of mCHA-C. FE-SEM images of (b) mCHA-C, (c) mCHA zeolite on cotton, and (d) mCHA zeolite after removing cotton fiber by calcination. HRTEM images and corresponding FFT of individual CHA crystals taken along the (e, f) [211] and (g, h) [10] zone axes, respectively. i, m CTF-corrected and denoised images using a Wiener filter at a defocus value of −630 nm and −22 nm, respectively, (j, n) Cmm and P2 projection symmetry-imposed and lattice-averaged images, where the averaged in-channel contrast in (j) might originate from either adsorbate species or CTF effects (k, o) simulated projected potential maps with a point spread function width of 1.4 Å, (l, p) projected structural models of the CHA along [211] and [10] zone axes, respectively

