Fig. 3.
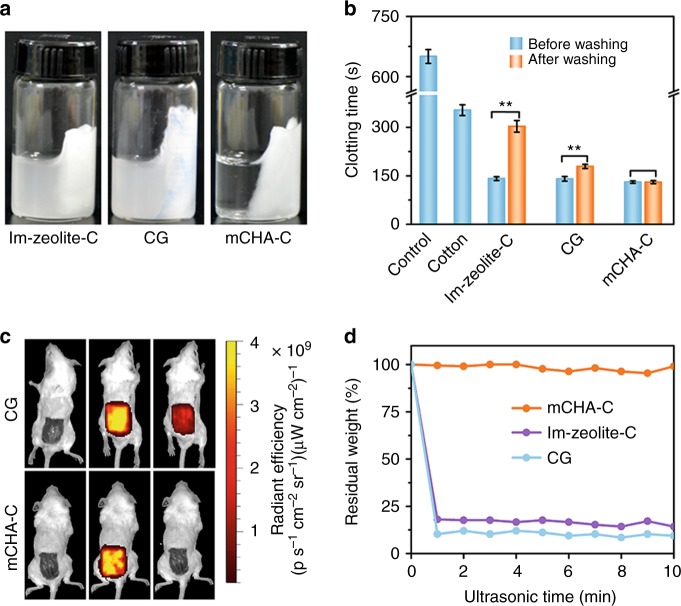
Binding strength of hemostatic component and matrix. a Photograph of Im-zeolite-C, CG, and mCHA-C after soaking into water. b Plasma clotting time of hemostats before and after washing with deionized water. Source data are provided as a Source Data file. Data values corresponded to mean ± standard deviation (SD), n = 3. Error bars represent SD. **P < 0.01, one-way analysis of variance (ANOVA). c Fluorescence imaging of mice skin wound before (left), during (mid), and after (right) being treated with Cy5-labeled mCHA-C and CG, respectively. d The relative residual weight of hemostatic component on mCHA-C (orange), Im-zeolite-C (violet), CG (turquoise) after different ultrasonic time. Source data are provided as a Source Data file

