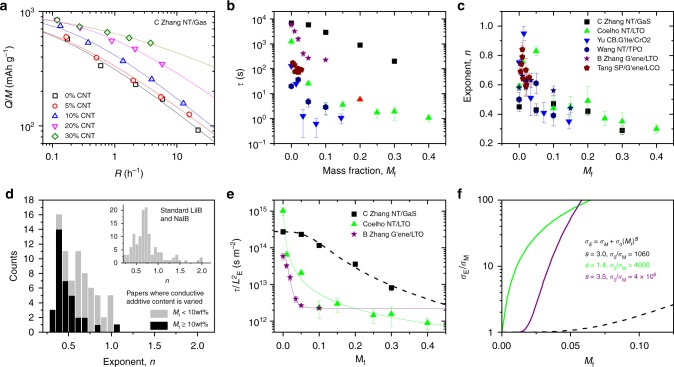
Fig. 3.
The effect of varying the content of conductive additives. a Specific capacity versus rate data for lithium ion anodes based on composites of GaS nanosheets and carbon nanotubes with various nanotube mass fractions7. The solid lines are fits to Eq. (2). b and c Characteristic time (b) and exponent (c), extracted from six papers (refs. 7,18,65,67–69), plotted versus the mass fraction, Mf, of conductive additive. d Histogram (N = 75) showing frequency of occurrence of n in studies which varied the conductive additive content. The histogram contains data from the papers in b, as well as additional refs. 19,70–73 and is divided between electrodes with high and low Mf. The inset replots the data from Fig. 2f for comparison. e Data for plotted versus Mf for three selected papers7,18,67. The solid lines are fits to Eq. (6a) combined with percolation theory (Eq. (7). f Out of plane conductivity, σE, of composite electrodes normalised to the conductivity of the active material alone, σM. This data is extracted from the fits in (e) with the legend giving the relevant parameters. N.B. the legend/colour coding in c applies to b, c, e, f. All errors in this figure are fitting errors combined with measurement uncertainty

