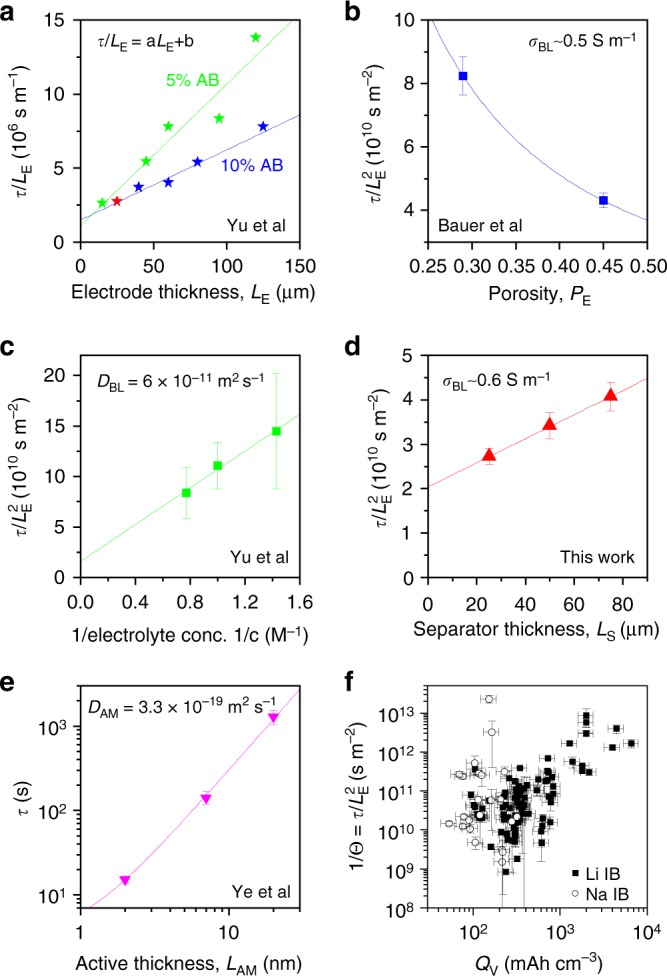
Fig. 5.

Further testing of the terms in Eq. (6a), (6b). a versus LE for electrodes with 5% and 10% acetylene black, and so different conductivities (extracted from ref. 16). This results in different a parameters (slopes) but the same b parameter (intercept), consistent with Eq. (6a), (6b). b versus porosity extracted from ref. 19. The line is a fit to Eq. (9) and yields a value of σBL close to the expected value (see panel). c versus inverse electrolyte concentration extracted from ref. 16. The line is a fit to Eq. (10) and yields DBL close to the expected value (see panel). d versus separator thickness (this work). The line is a fit to Eq. (11) and yields σBL close to the expected value (see panel). e Characteristic time versus the thickness of a thin active layer (TiO2) extracted from ref. 12. The line is a fit to Eq. (12) and yields a diffusion coefficient for Li ions in anatase TiO2 close to the expected value85. f 1/Θ plotted versus the intrinsic volumetric electrode capacity, QV, for cohorts I and II showing the scaling predicted by Eq. (13a). All errors in this figure are fitting errors combined with measurement uncertainty
