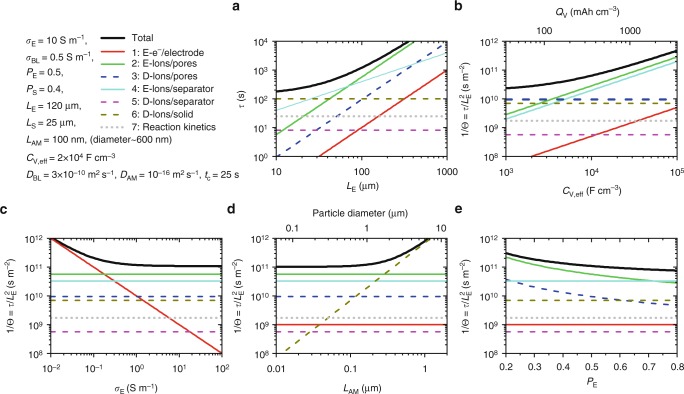
Fig. 6.
Comparison of the magnitude of terms 1−7 in Eq. (13a) as well as their sum, for a range of electrode parameters. Note that, while in a, τ is plotted versus LE, in all other panels, 1/Θ is plotted versus the relevant parameter. The parameters used are given at the top left. Those bold parameters were kept constant in all panels except one, where they were varied. The solid black lines represent the total value of τ or 1/Θ. Low values of both τ and 1/Θ are needed for good rate performance. The other curves represent the seven individual terms in Eq. (13a), labelled 1−7 (numbered from left to right in the equation). Electrical and diffusion limited terms are marked as solid and dashed lines, respectively, with the reaction kinetics term represented by grey dots. The legend in the top left gives the term number as well of a summary of what it represents. Those terms labelled by “E” are electrically limited while those labelled by “D” are diffusion limited. The top axis in b represents the volumetric capacity of the electrode calculated using . N.B., LAM = 100 nm corresponds to a particle diameter of 2r ≈ 600 nm because LAM = r/3 for pseudo-spherical particles

