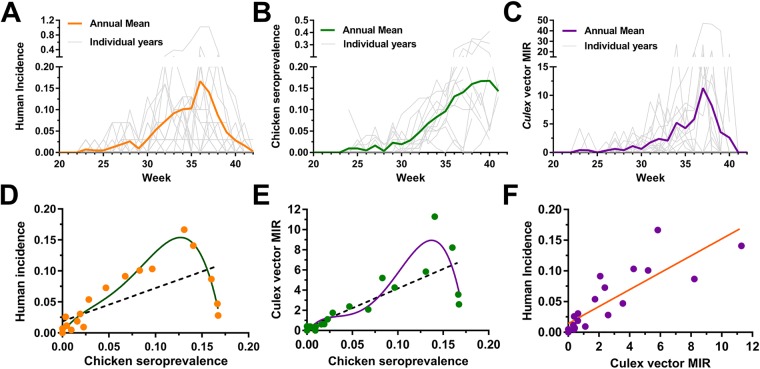
Figure 1.
Seasonality of WNV transmission in human, avian, and mosquito hosts. WNV infection data from Iowa (2002–2016) were analyzed and displayed as weekly values for individual years or as the annual mean of human incidence (A), sentinel chicken seroprevalence (B), or Culex minimum infection rate (MIR) (C). Correlations between different host (human, avian, mosquito) infection rates were examined by plotting averaged weekly values (weeks 20–40; data points on graph) to determine the strength of host interactions involved in WNV transmission (D–F). A linear regression (black dashed line; R2 = 0.45, P < 0.001) or a best-fit 4th order polynomial (green line; R2 = 0.94) were used to explain sentinel chicken seroprevalence correlations to human incidence (D). Similar linear regression (black dashed line; R2 = 0.63, P < 0.001) and best-fit 4th order polynomial (purple line; R2 = 0.86) were performed to examine the effects of Culex MIR in estimating sentinel chicken seroprevalence (E). The non-linear relationship best explains the declining human incidence or mosquito MIR, while sentinel chicken seroprevalence remained high at the end of the season (E). Linear regression (orange line; R2 = 0.71, P < 0.0001) analysis of Culex MIR and human WNV incidence (F).

