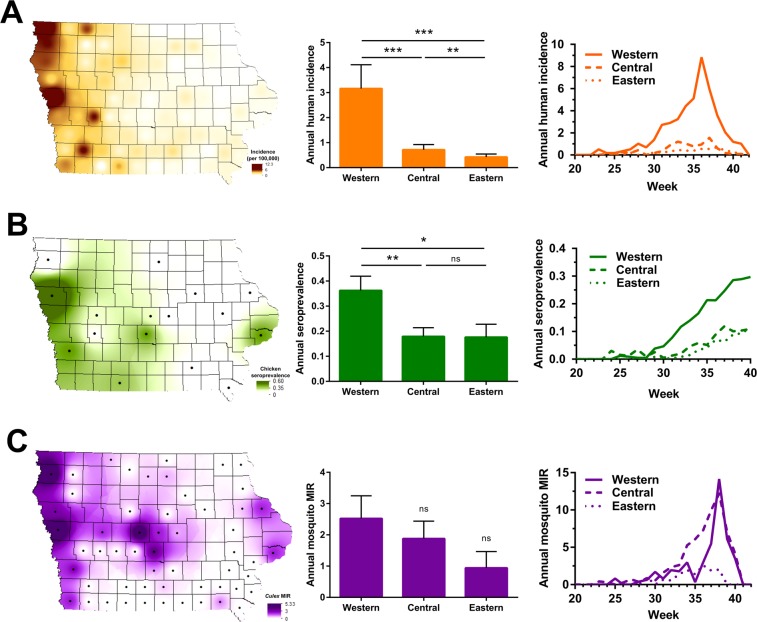
Figure 2.
Spatial distributions of WNV in human, avian, and mosquito hosts. WNV infections from 2002–2016 are displayed at the county level and spatially presented as the annual mean of human incidence (A), sentinel chicken seroprevalence (B), or Culex MIR (C) across the state. Additional analyses display the annual mean or weekly infection rates by regional associations in Iowa – western, central, and eastern (A–C). Human incidence (A) is displayed as the number of human WNV cases per 100,000 people. Sentinel chicken seroprevalence (B) is defined as the ratio of WNV+ seropositive birds per total birds sampled. Culex MIR (C) is calculated as the minimum infection rate for all Culex mosquito vectors (Cx. pipiens group, Cx. tarsalis, and Cx. erraticus). The black dots display counties in which chicken seroprevalence and mosquito infection rate data were collected. A Wilcoxon matched-pairs signed rank test was used to test for differences between groups with significance denoted by asterisks (*P < 0.05, **P < 0.01, ***P < 0.001). ns, not significant.

