Fig. 6.
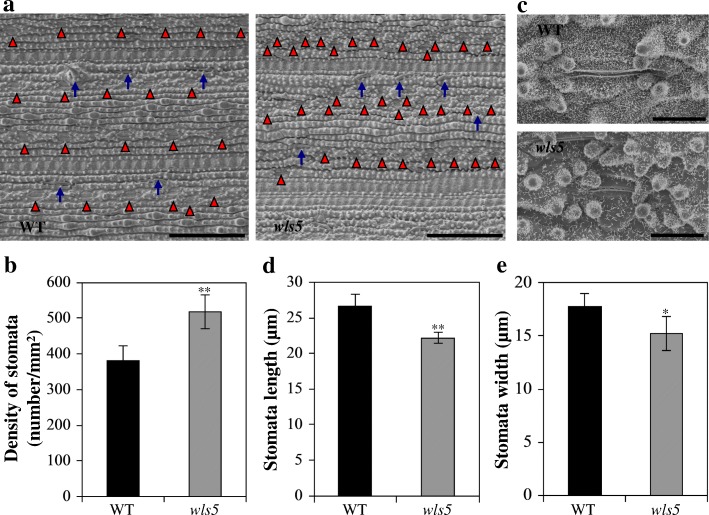
Observation of stomata in wild-type (WT) and wls5 plants. a Stomatal density of WT (‘93–11’) and wls5 leaves at tillering stage. Red triangles and blue arrows indicate the positions of stomata and setae, respectively. Bars = 100 μm. b Statistical analysis of stomatal density. c Morphological characteristics of stomata of WT and wls5 plants at tillering stage. Bars = 10 μm. d, e Statistical analysis of stomata length (d) and stomata width (e). Three independent replicates for stomatal density, and 20 independent replicates for stomata size. **P < 0.01 (Student’s t-test)

