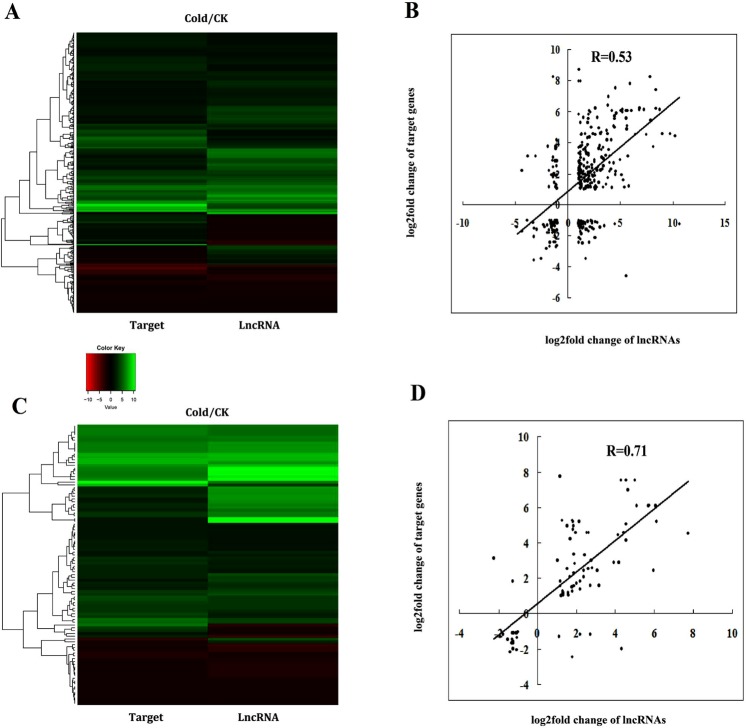
Figure 5.
Comparison of the expression changes of differentially expressed lncRNAs, related target genes, and the correlation between them. The heatmap was generated from the fold change values in the RNA-seq data and was used to visualize the lncRNAs and cis-regulated relation target expression changes (A) and the lncRNAs and trans-regulated relation target expression changes (C). (B) The correlation between the expression changes of lncRNAs and cis-regulated relation target. The values along the x-axis are the log2fold change of lncRNAs (fold change = FPKM value of genes in the cold treatment/FPKM value of lncRNA genes in the control). The values along the y-axis are the log2fold change of their target genes in cis-regulatory relationships (fold change = FPKM value of genes in the cold treatment/FPKM value of genes in the control). (D) The correlation between the expression changes of lncRNAs and trans-regulated relation target. The values along the x-axis are the log2fold change of lncRNAs (fold change = FPKM value of genes in the cold treatment/FPKM value of lncRNA genes in the control). The values along the y-axis are the log2fold change of their target genes in trans-regulatory relationships (fold change = FPKM value of genes in the cold treatment/FPKM value of genes in the control).

