
Figure 5.
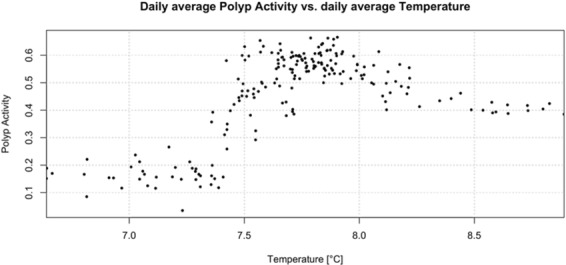
The daily averages for temperature () are plotted against daily averages for the polyp activity (). The estimated pearson correlation coefficient between both is 0.54.
Official websites use .gov
A
.gov website belongs to an official
government organization in the United States.
Secure .gov websites use HTTPS
A lock (
) or https:// means you've safely
connected to the .gov website. Share sensitive
information only on official, secure websites.
The daily averages for temperature () are plotted against daily averages for the polyp activity (). The estimated pearson correlation coefficient between both is 0.54.