Fig. 1.
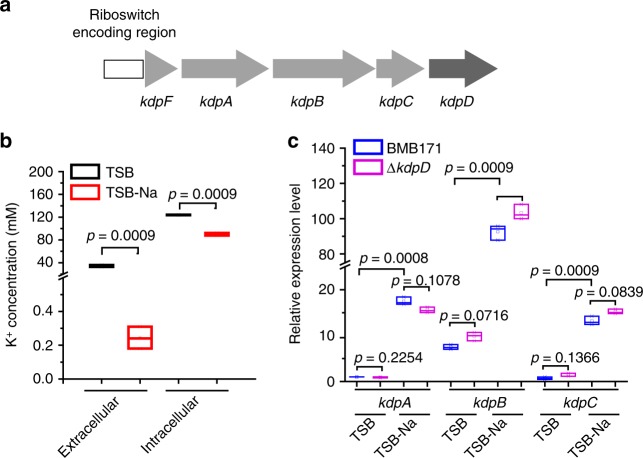
The kdp operon is induced under K+ limitation stress in BMB171. a A schematic presentation of kdp operon and kdpD gene. The cyclic diadenylate monophosphate (c-di-AMP) riboswitch encoding region is shown as a white rectangle, and the kdpFABC genes are depicted by thick light-gray arrows, while the kdpD by a thick dark-gray arrow. b Extracellular and intracellular K+ concentrations of BMB171 grown in TSB and TSB-Na. Data are expressed as box-and-whisker plots, where the central lines denote medians, edges represent upper and lower quartiles, and whiskers show minimum and maximum values. Data were subjected to one-way analysis of variance (ANOVA) using the Bonferroni test, n = 3; p values are shown above each panel. c Relative expression levels of kdpA, kdpB, and kdpC genes from BMB171 and ΔkdpD grown in TSB and TSB-Na. Data are expressed as box-and-whisker plots, where the central lines denote medians, edges represent upper and lower quartiles, and whiskers show the minimum and maximum values. Data were subjected to one-way analysis of variance (ANOVA) using the Bonferroni test, n = 3; p values are shown above each panel. Data underlying the plots in b, c are available in Supplementary Data 5

