
Fig. 4.
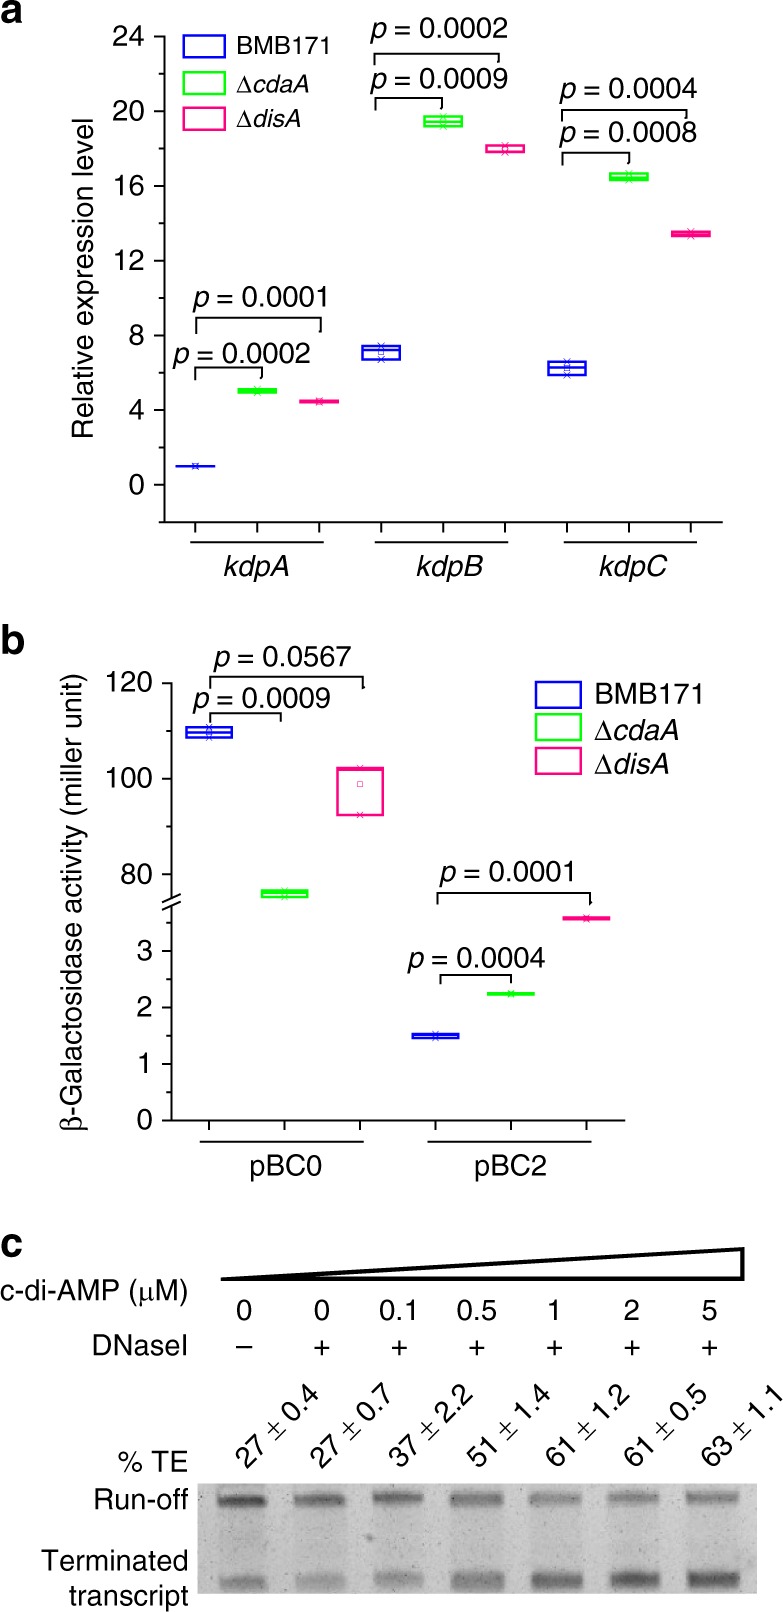
Influence of cyclic diadenylate monophosphate (c-di-AMP) concentration on the transcription of kdp operon. a Relative expression levels of kdpA, kdpB, and kdpC genes in the BMB171, ΔcdaA, and ΔdisA strains grown in GYS measured by real-time quantitative PCR (RT-qPCR). Data are expressed as box-and-whisker plots, where the central lines denote medians, edges represent upper and lower quartiles, and whiskers show the minimum and maximum values. Data were subjected to one-way analysis of variance (ANOVA) using the Bonferroni test, n = 3; p values are shown above each panel. b β-Galactosidase activities for BMB171-pBC0, ΔcdaA-pBC0, ΔdisA-pBC0, BMB171-pBC2, ΔcdaA-pBC2, and ΔdisA-pBC2 strains were indicated in the figure. The results were given in Miller units. Data are expressed as box-and-whisker plots, where the central lines denote medians, edges represent upper and lower quartiles, and whiskers show the minimum and maximum values. Data were subjected to one-way analysis of variance (ANOVA) using the Bonferroni test, n = 3; p values are shown above each panel. Data underlying the plots in a, b are available in Supplementary Data 5. c In vitro transcription assay conducted in the presence of various c-di-AMP concentrations ranging from 0 to 5 µM. Termination efficiency (% TE) was calculated by the formula: