Figure 1.
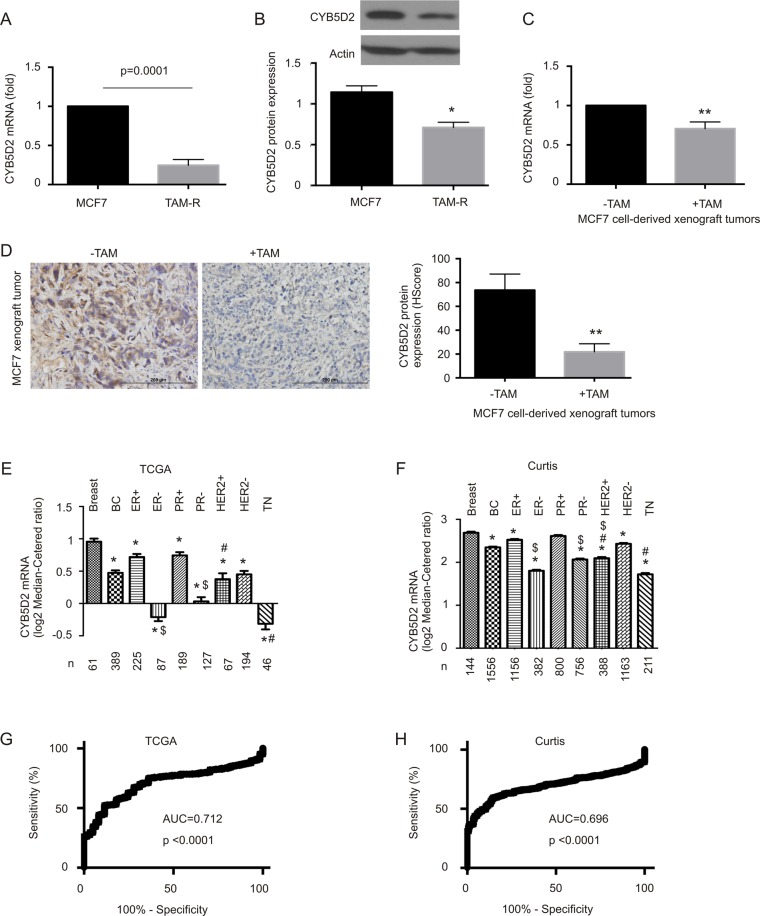
Downregulation of CYB5D2 associates with BC tumorigenesis. (A) Real time PCR amplification of CYB5D2 mRNA in MCF7 and TAM-R cells. β-actin was used as an internal control. CYB5D2 mRNA levels were normalized to those of β-actin. Experiments were repeated three times; means ± SD (standard deviation) were graphed. Statistical analysis was performed using Student’s t-test (2-tails). (B) Western blot analysis of CYB5D2 protein expression in MCF7 and TAM-R cells. Experiments were repeated three times; typical images are provided (please see Fig S14 for the non-cropped Western blot). CYB5D2 protein expression was normalized to Actin; means ± SD are graphed; *p < 0.05 determined by 2-tailed Student’s t-est. (C,D) MCF7 cell-derived xenograft tumors were generated in NOD/SCID mice, followed by treatment with and without TAM. CYB5D2 expression in treated (+TAM) and untreated (−TAM) xenograft tumors (n = 5 for each group) was determined by real time PCR (C) and IHC (D). Typical IHC images are presented. **p < 0.01 in comparison to untreated tumors (2-tailed Student’s t-test). (E,F) CYB5D2 mRNA expression data were extracted from the datasets of TCGA (E)34 and Curtis (F)6. Mean ± SD for the indicated BC subtypes are graphed. *p < 0.05 by an unpaired, two-tailed, welch-corrected t-test; *p < 0.05 in comparison to normal breast tissues (Breast); $p < 0.05 in comparison to the respective ER+ and PR+ tumors; and #p < 0.05 in comparison to ER+ breast tumors. (G,H) Receiver-operating characteristic (ROC) curves of normal breast tissues versus primary breast tumors were derived from the indicated datasets. AUC: area under the curve.

