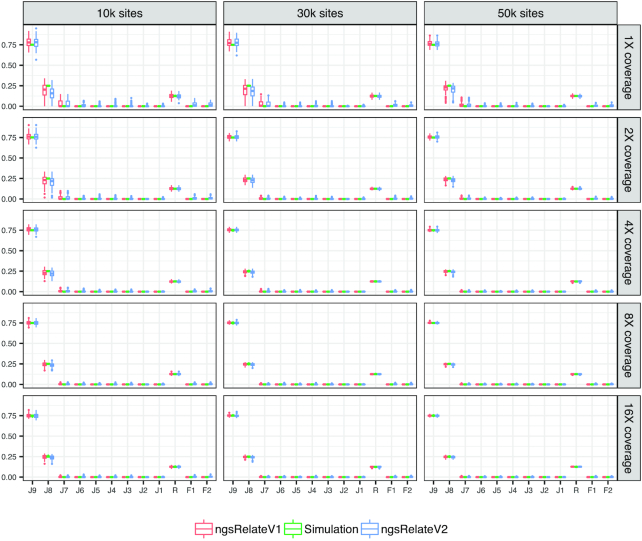
Figure 1:
Scenario 1: 100 independent simulations of 2 outbred cousins across variable sequencing depth and informative sites with a MAF cutoff on 10%. J9 to J1 refer to the 9 Jacquard coefficients, R is the relatedness, and F1 and F2 refer to the individual inbreeding coefficients. Simulation (green) are the true values against which we compare ngsRelateV1 (red) and the new program ngsRelateV2 (blue).

