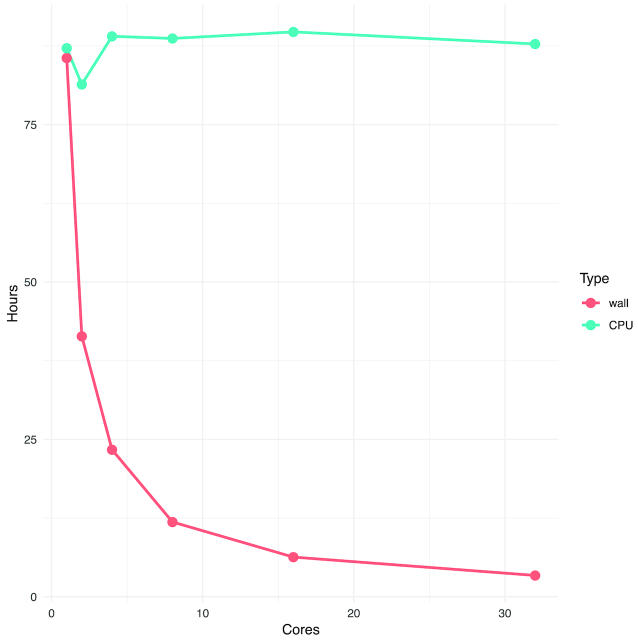
Figure 5:
Runtimes for ngsRelateV2 on a dataset with 135 individuals with 164 mio possible single-nucleotide polymorphism sites. The blue line indicates the overall CPU usage across all threads allocated to the main process. The red line indicates the runtime for the process to finish. The actual values along with memory usage can be found in Table 4.

