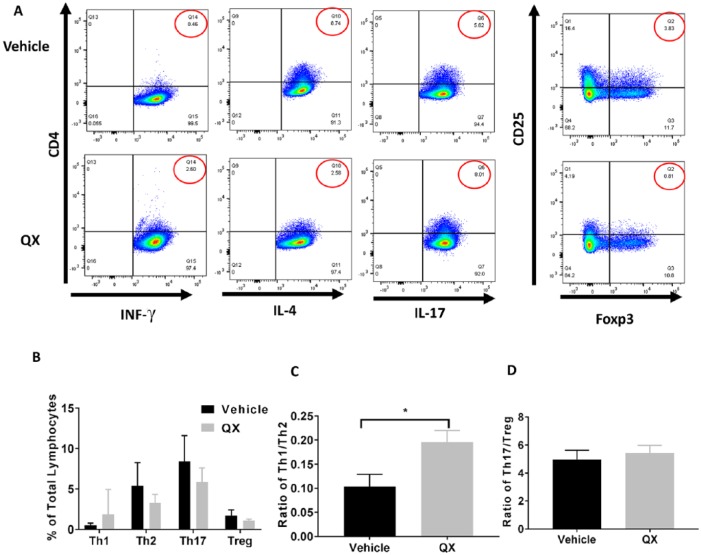
Figure 5.
T helper cell profiling in Quxie capsule (QX)-treated spleen tissues. (A) Representative flow cytometry of T cells in spleen tissue. Numbers circled in red indicate percentage of Th1 (CD4+ IFN-γ+) cells, Th2 (CD4+ IL-4+) cells, Th17 (CD4+ IL-17+) cells (left panel), and Treg (CD25 + Foxp3+) cells (right panel). (B) Percentages of Th1, Th2, Th17, and Treg cells in spleen tissues. (C) The Th1/Th2 ratio in vehicle control- and QX-treated spleen tissues. (D) The Th17/Treg ratio in vehicle control- and QX-treated spleen tissues. Data are presented as mean ± SD. *P < .05 versus vehicle control.

