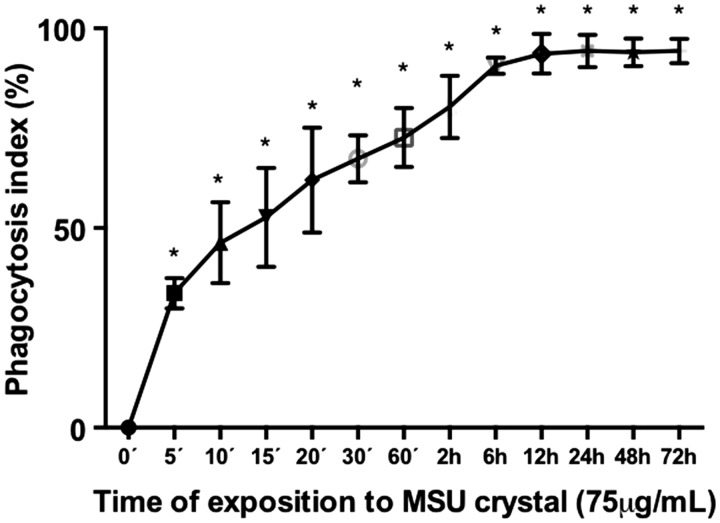
Figure 3.
Dose response curve of PhIx of MSU crystal by FLS. Quantification of cells with internalized MSU crystals was determined by polarized light microscopy. Data are presented as mean value ± standard deviation of at least three independent experiments. *P value ≤0.05 in comparison to zero time. PhIx: phagocytic index.

