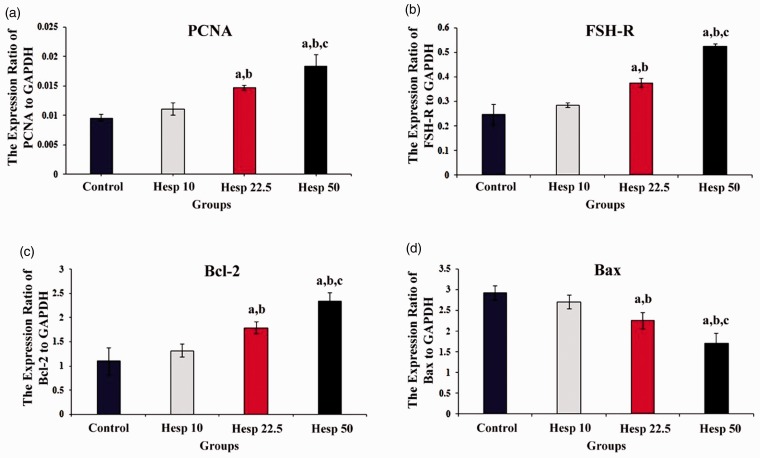
Figure 4.
The mRNA expression levels of PCNA, FSH-R, Bcl-2, and Bax genes in all groups of the study–control, Hesp 10, Hesp 22.5, and Hesp 50—on the last day of the culture period, day 12. Values are mean ± standard deviation (SD). Hesp: Hesperidin. (a) The mRNA expression of PCNA; a, b, and c show significant differences compared with the control group (p < 0.05), Hesp 10 group (p < 0.04), and Hesp 50 group (p < 0.003), respectively. (b) The mRNA expression of FSH-R; a, b, and c show significant differences compared with the control group (p < 0.05), Hesp 10 group (p < 0.05), and Hesp 50 group (p < 0.001), respectively. (c) The mRNA expression of Bcl-2; a, b, and c show significant differences compared with the control group (p < 0.05), Hesp 10 group (p < 0.05), and Hesp 50 group (p < 0.02), respectively. (d) The mRNA expression of Bax; a, b, and c show significant differences compared with the control group (p < 0.05), Hesp 10 group (p < 0.003), and Hesp 50 group (p < 0.001), respectively. (A color version of this figure is available in the online journal.)

