Figure 2.

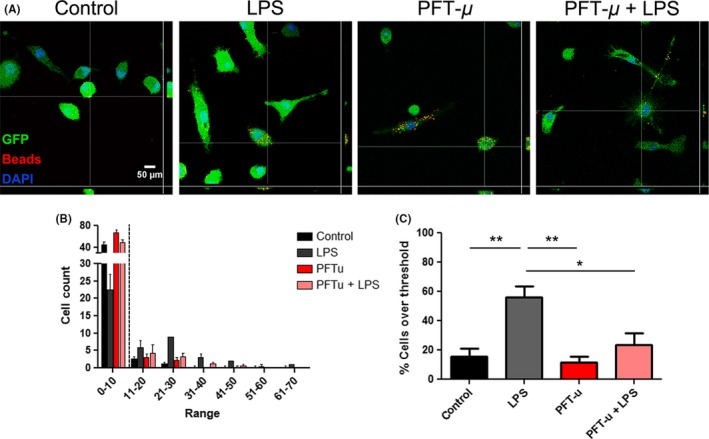
PFT‐μ modulates microglial phagocytic activity under inflammatory conditions. A, Representative confocal images of GFP + adult primary microglia exposed to latex beads for 2 hours following treatment. Orthogonal view of colocalization indicates cellular phagocytosis. Scale bar = 50 μm. B, Binning analysis was applied to the number of beads consumed per cell. A minimum of 40 cells were counted per replicate (n = 4). Dotted line indicates threshold at which cells were considered phagocytically active. C. Percent cells over threshold (greater than 10 beads per cell) were quantified. One‐way ANOVA followed by Bonferroni's post hoc test was used to determine the significance between experimental and control groups. Data are shown as mean ± SEM. *P < .05, **P < .01
