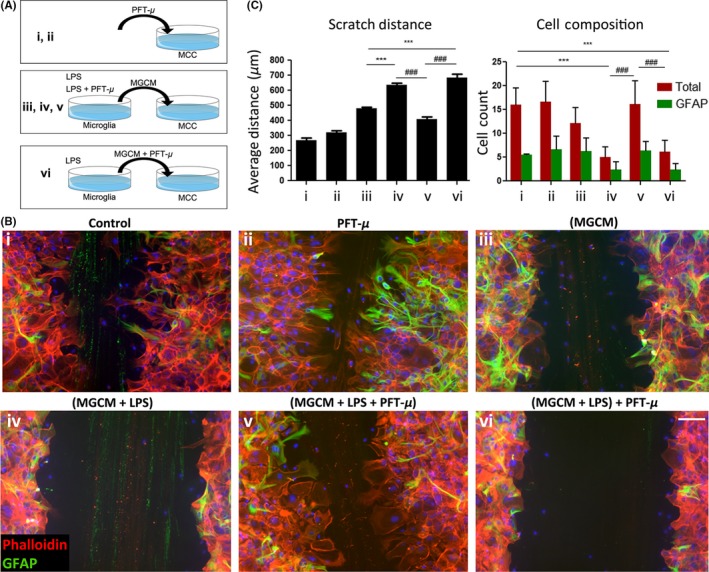
Figure 3.

PFT‐μ modulates inflammatory response and cellular migration. A, Experimental scheme detailing treatment combinations. B, Representative images of scratch wound from phalloidin/GFAP‐stained MCCs, 48 hours following treatments. Eight images were taken across three individual scratches per well. DAPI counterstain in blue. C, Average scratch distance (left) and number of migrating cells (right). MGCM—microglia‐conditioned medium. One‐way ANOVA followed by Bonferroni's post hoc test was used to determine the significance between experimental and control groups. Data are shown as mean ± SEM. *P < .05, **P < .01, ***P < .001. * = comparisons made against (MGCM). # = comparisons made against (MGCM + LPS + PFT‐μ). ^ = comparisons made against control
