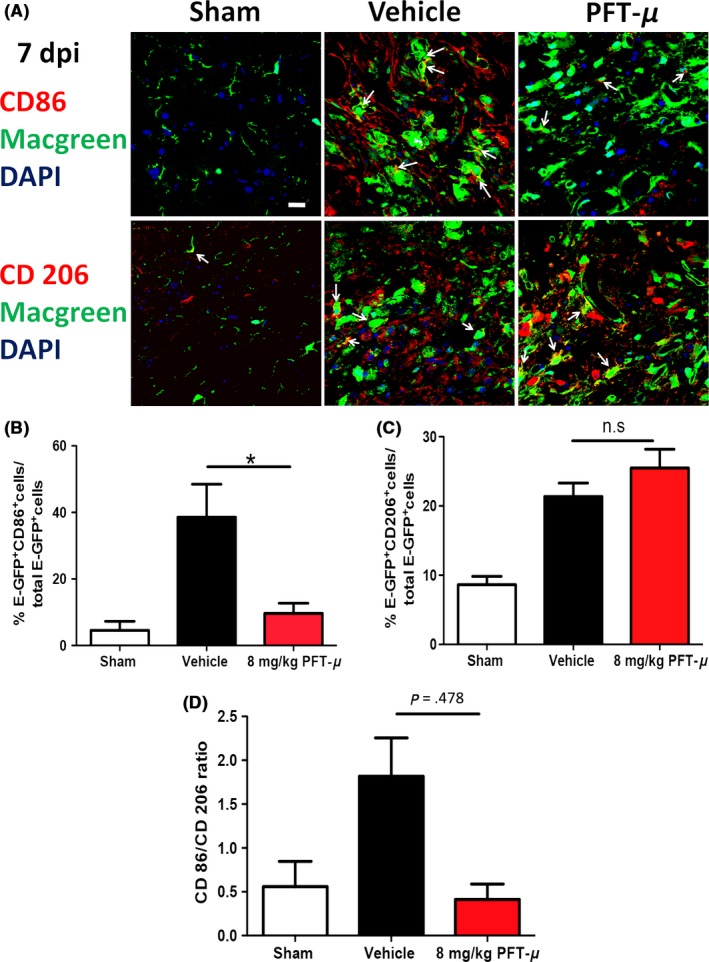
Figure 6.

PFT‐μ reduced the expression of CD86 and increased the expression of CD206 at 7 dpi. A, Representative images from tissue sections from MacGreen mice at 7 dpi that were immunofluorescently labeled with CD86 (top) or CD206 (bottom). Images were taken of microglia/macrophages present within the injury site. Six images were taken per section and 5 sections were imaged per biological replicate. White arrows point to double positive cells. Scale = 20 μm. n = 3 per group. B, C, Quantification of the percentage of microglia/macrophages positive for CD86 and CD206. D, The ratio of CD86+ to CD206+ microglia/macrophages is shown. n = 3 per group. One‐way ANOVA followed by Tukey's HSD post hoc was used to determine the significance between experimental and control groups. Data are shown as mean ± SEM. *P < .05
