
Figure 7.
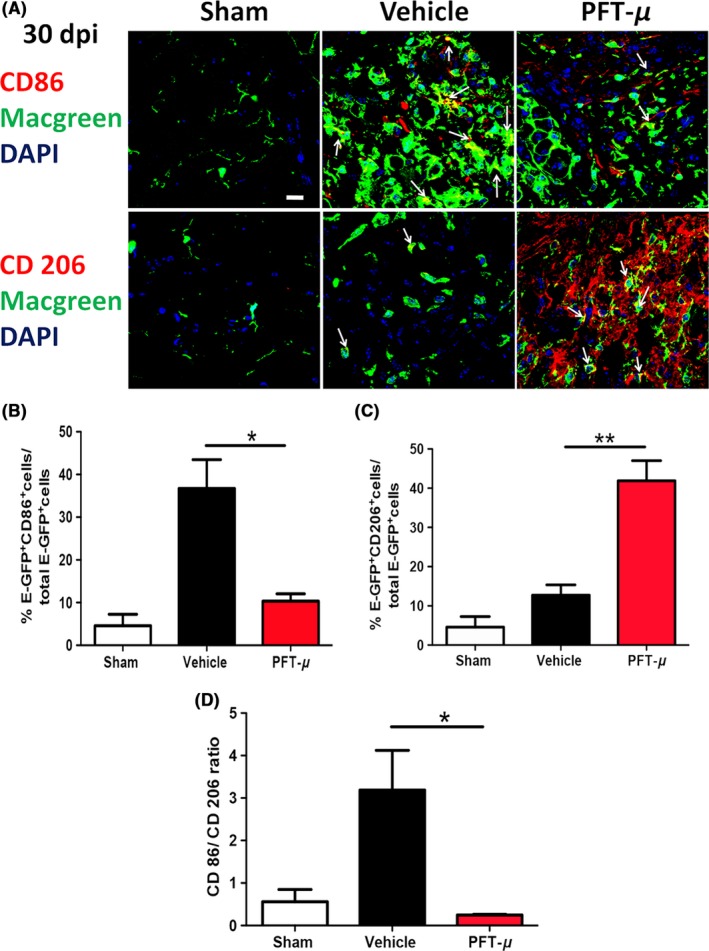
PFT‐μ maintained the anti‐inflammatory phenotype 30 days post‐SCI. A, Representative images from tissue sections from MacGreen mice at 30 dpi that were immunofluorescently labeled with CD86 (top) or CD206 (bottom). Images were taken of microglia/macrophages present within the injury site. Six images were taken per section and 5 sections were imaged per biological replicate. White arrows point to double positive cells. Scale = 20 μm. n = 3 per group. B, C, Quantification of the percentage of microglia/macrophages positive for CD86 and CD206. D, The ratio of CD86+ to CD206+ microglia/macrophages is shown. n = 3 per group. One‐way ANOVA followed by Tukey's HSD post hoc was used to determine the significance between experimental and control groups. Data are shown as mean ± SEM. *P < .05, **P < .01