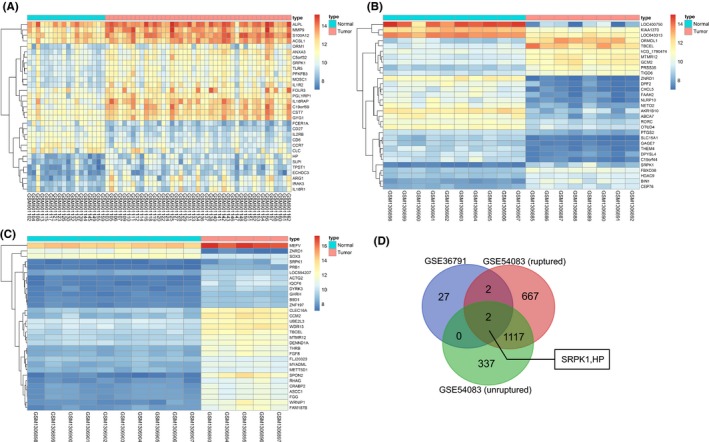
Figure 1.

GEO data analysis shows that SRPK1 is associated with IA. Panel A, B, and C, heat map shows the differentially expressed genes in IA tissue. The heat map shows the analysis of IA expression microarray. The horizontal axis represents the samples, and the vertical axis represents the genes. The upper red and blue strip represents the sample type; whereby blue represents the normal sample, and the red represents the IA sample. The left dendrogram represents the clustering results among genes; each square indicates the expression of a gene in a sample. The upper right histogram color indicates the level of expression, whereby the red suggests a high expression, and the blue suggests a low expression value. Panel D, Venn diagram illustrates the overlap of differential expressed genes between IA tissue and normal tissue. The blue color represents the differentially expressed genes in the GSE36791 expression profile analysis, the red represents the differentially expressed genes of the IA rupture, and the green indicates the UIA in the GSE54083 expression profile analysis. The blue arrow shows the SRPK1 and HP1 genes in the intersection among the 3 data groups. The digital in each shape reflect the number of genes. IA, intracranial aneurysm; SRPK1, SR protein‐specific kinases
