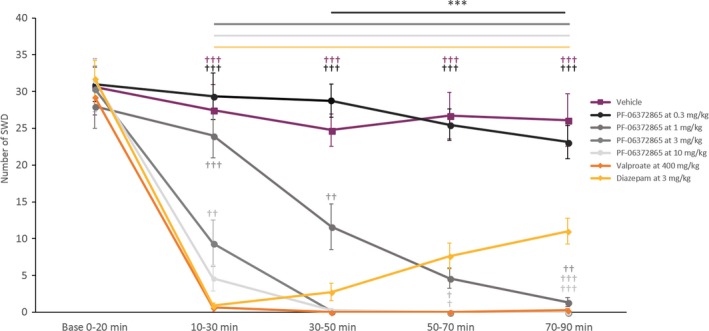
Figure 1.

Number of SWD (mean ± SEM, n = 8) during baseline and postadministration periods, in all pharmacological conditions. ***P < 0.001; as compared to the vehicle; ††,†††,†††† P < 0.01, 0.001, and 0.0001, respectively, as compared to diazepam

Number of SWD (mean ± SEM, n = 8) during baseline and postadministration periods, in all pharmacological conditions. ***P < 0.001; as compared to the vehicle; ††,†††,†††† P < 0.01, 0.001, and 0.0001, respectively, as compared to diazepam