
Figure 3.
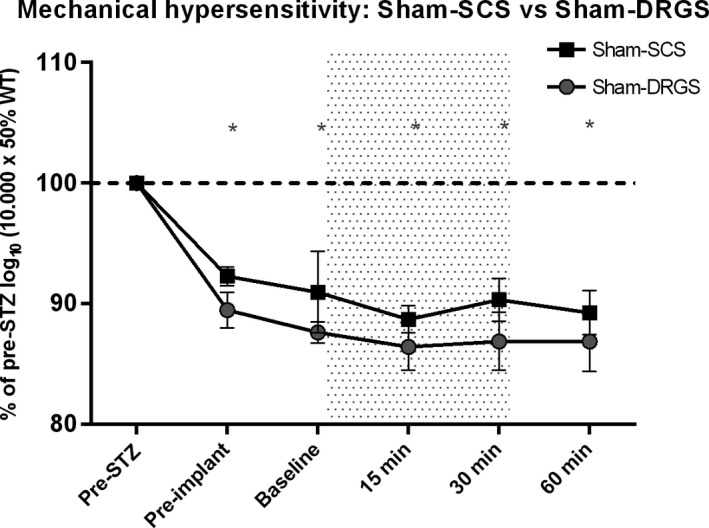
Effect of sham‐SCS (n = 3) and sham‐DRGS (n = 7) on mechanical hypersensitivity. Data are presented as mean % of pre‐STZ log10 (10 000 × 50% WT) ± SEM. Data are compared to pre‐STZ values and pre‐stimulation baseline values. *P < 0.05 compared to pre‐STZ values. SCS, spinal cord stimulation; DRGS, dorsal root ganglion stimulation; STZ, streptozotocin; SEM, standard error of mean; min, minutes