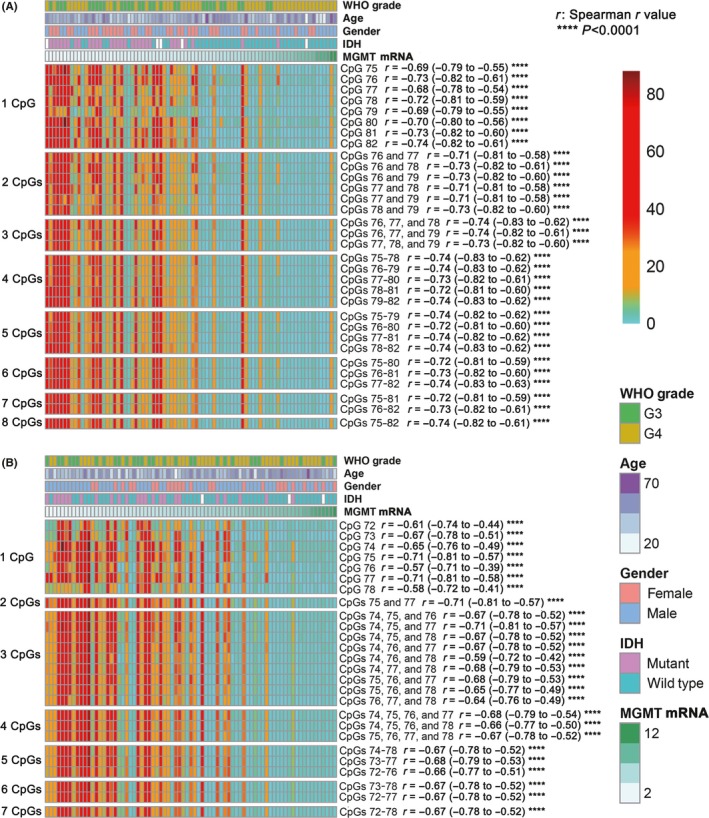
Figure 2.

Correlation of MGMT mRNA expression to the methylation level of MGMT promoter individual CpG or CpG combinations. A and B, The methylation level of individual CpG or CpG combinations is applied to heatmap in the eight‐site cohort (A) and the seven‐site cohort (B). The methylation level of a CpG combination is the average methylation level of all CpGs included in this combination. “r” is the Spearman r value, and the 95% confidence interval of the “r” is shown in the following bracket, respectively. ****P < 0.0001
