Figure 1.

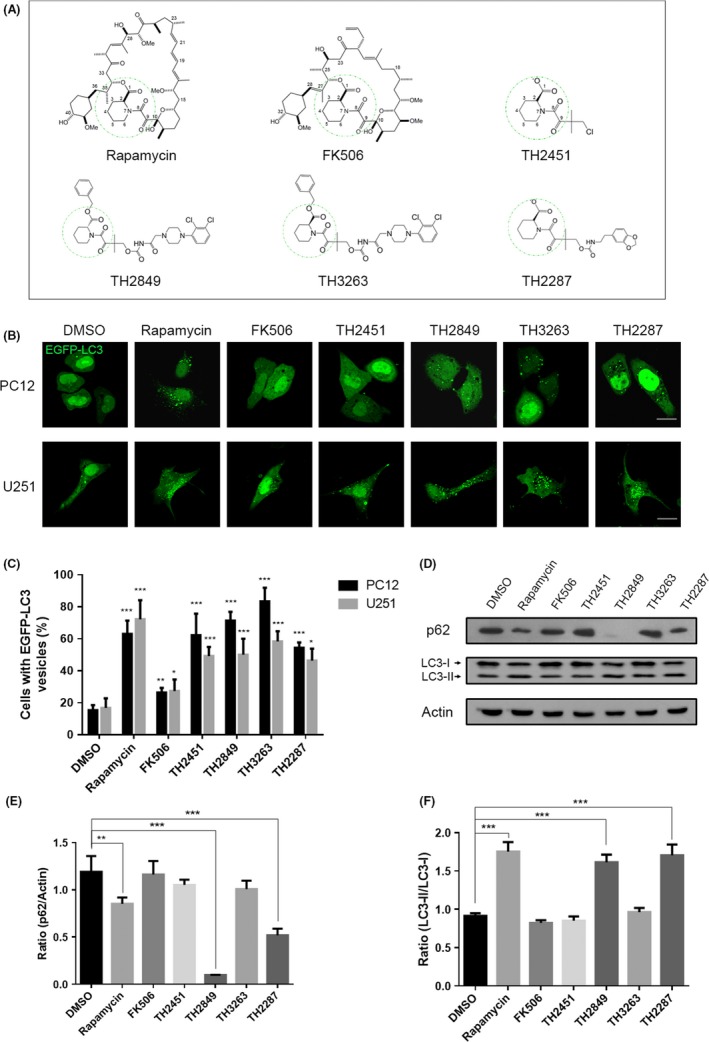
1 Screening potentially autophagy induction of TH compounds. (A) Structures of rapamycin, FK506, and TH compounds (TH2451, TH 2849, TH3263, and TH2287). Representative images (B) and quantification (C) of PC12 and U251 cells with EGFP‐LC3 vesicles (autophagosomes). The EGFP‐LC3 transfected cells were treated with 1‰ DMSO, 1 μmol/L rapamycin, 10 μmol/L FK506, 1 μmol/L TH compounds for 24 h as indicated. (D) Representative Western blotting image of p62 and LC3 I/II levels after 1‰ DMSO, 1 μmol/L rapamycin, 10 μmol/L FK506, 1 μmol/L TH compounds treatment for 24 h. Quantification of relative p62 (E) and LC3 I/II (F) expression levels in (D). All the substances were dissolved in DMSO. Scale bars: 10 μm. Data are shown as the mean ± SEM *P < 0.05, **P < 0.01, ***P < 0.001 compared to DMSO control, n = 3
