
Figure 2.
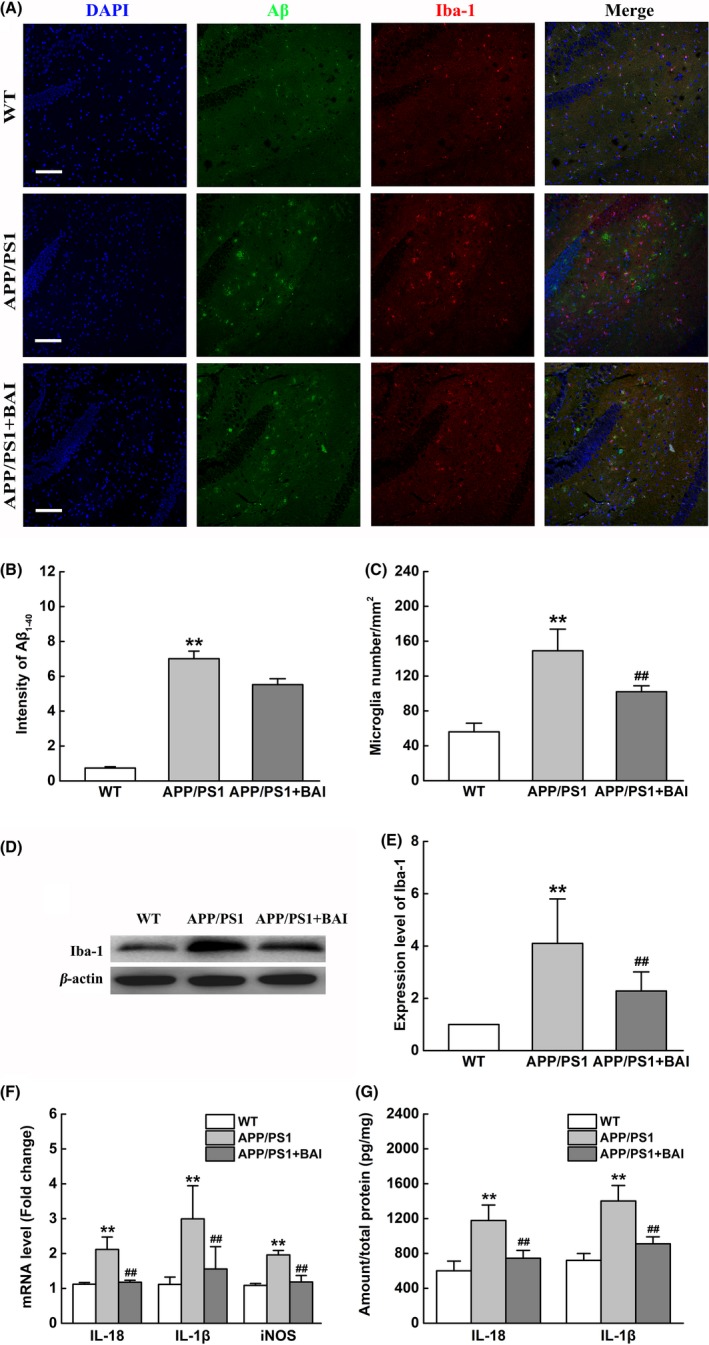
BAI treatment did not reduce Aβ deposition, but decreased microglial activation and proinflammatory cytokine production in APP/PS1 mice. (A) Immunofluorescent images of Aβ1‐40 (green)/Iba‐1 (red)/DAPI (blue) colocalization in the hippocampus of APP/PS1 mice. Scale bar: 100 μm. (B) Quantification of immunofluorescent intensity of Aβ1‐40 area (n = 8/group). (C) Quantification of microglial immunofluorescent number (n = 8/group). (D) Representative immunoblots probed with antibodies against Iba‐1 and β‐actin. (E) Quantification of the levels of Iba‐1 normalized to β‐actin (n = 4). (F) Graph showing the mRNA levels of IL‐1β, IL‐18, and iNOS in the hippocampus measured using RT‐PCR (n = 4). (G) Graph showing the levels of secreted IL‐1β and IL‐18 in the hippocampus measured using ELISA (n = 4). All data are presented as mean ± SD. **P < 0.01, compared with wild‐type (WT) group; ##P < 0.01, compared with APP/PS1 group