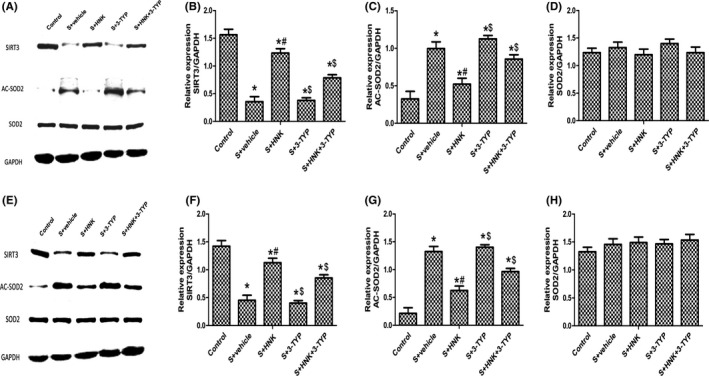
Figure 8.

Effects of HNK or 3‐TYP on SIRT3/SOD2 signaling pathway in surgery/anesthesia‐induced mice. (A, E) Representative blots at postoperative 1 and 3 d. (b, f) SIRT3 relative expression. (C, G) Ac‐SOD2 relative expression. (D, G) SOD2 relative expression. The data are presented as the mean ±standard error of the mean for each group (n = 6 per group). $P < 0.05 vs the surgery+HNK group; #P < 0.05 vs the surgery+vehicle group
